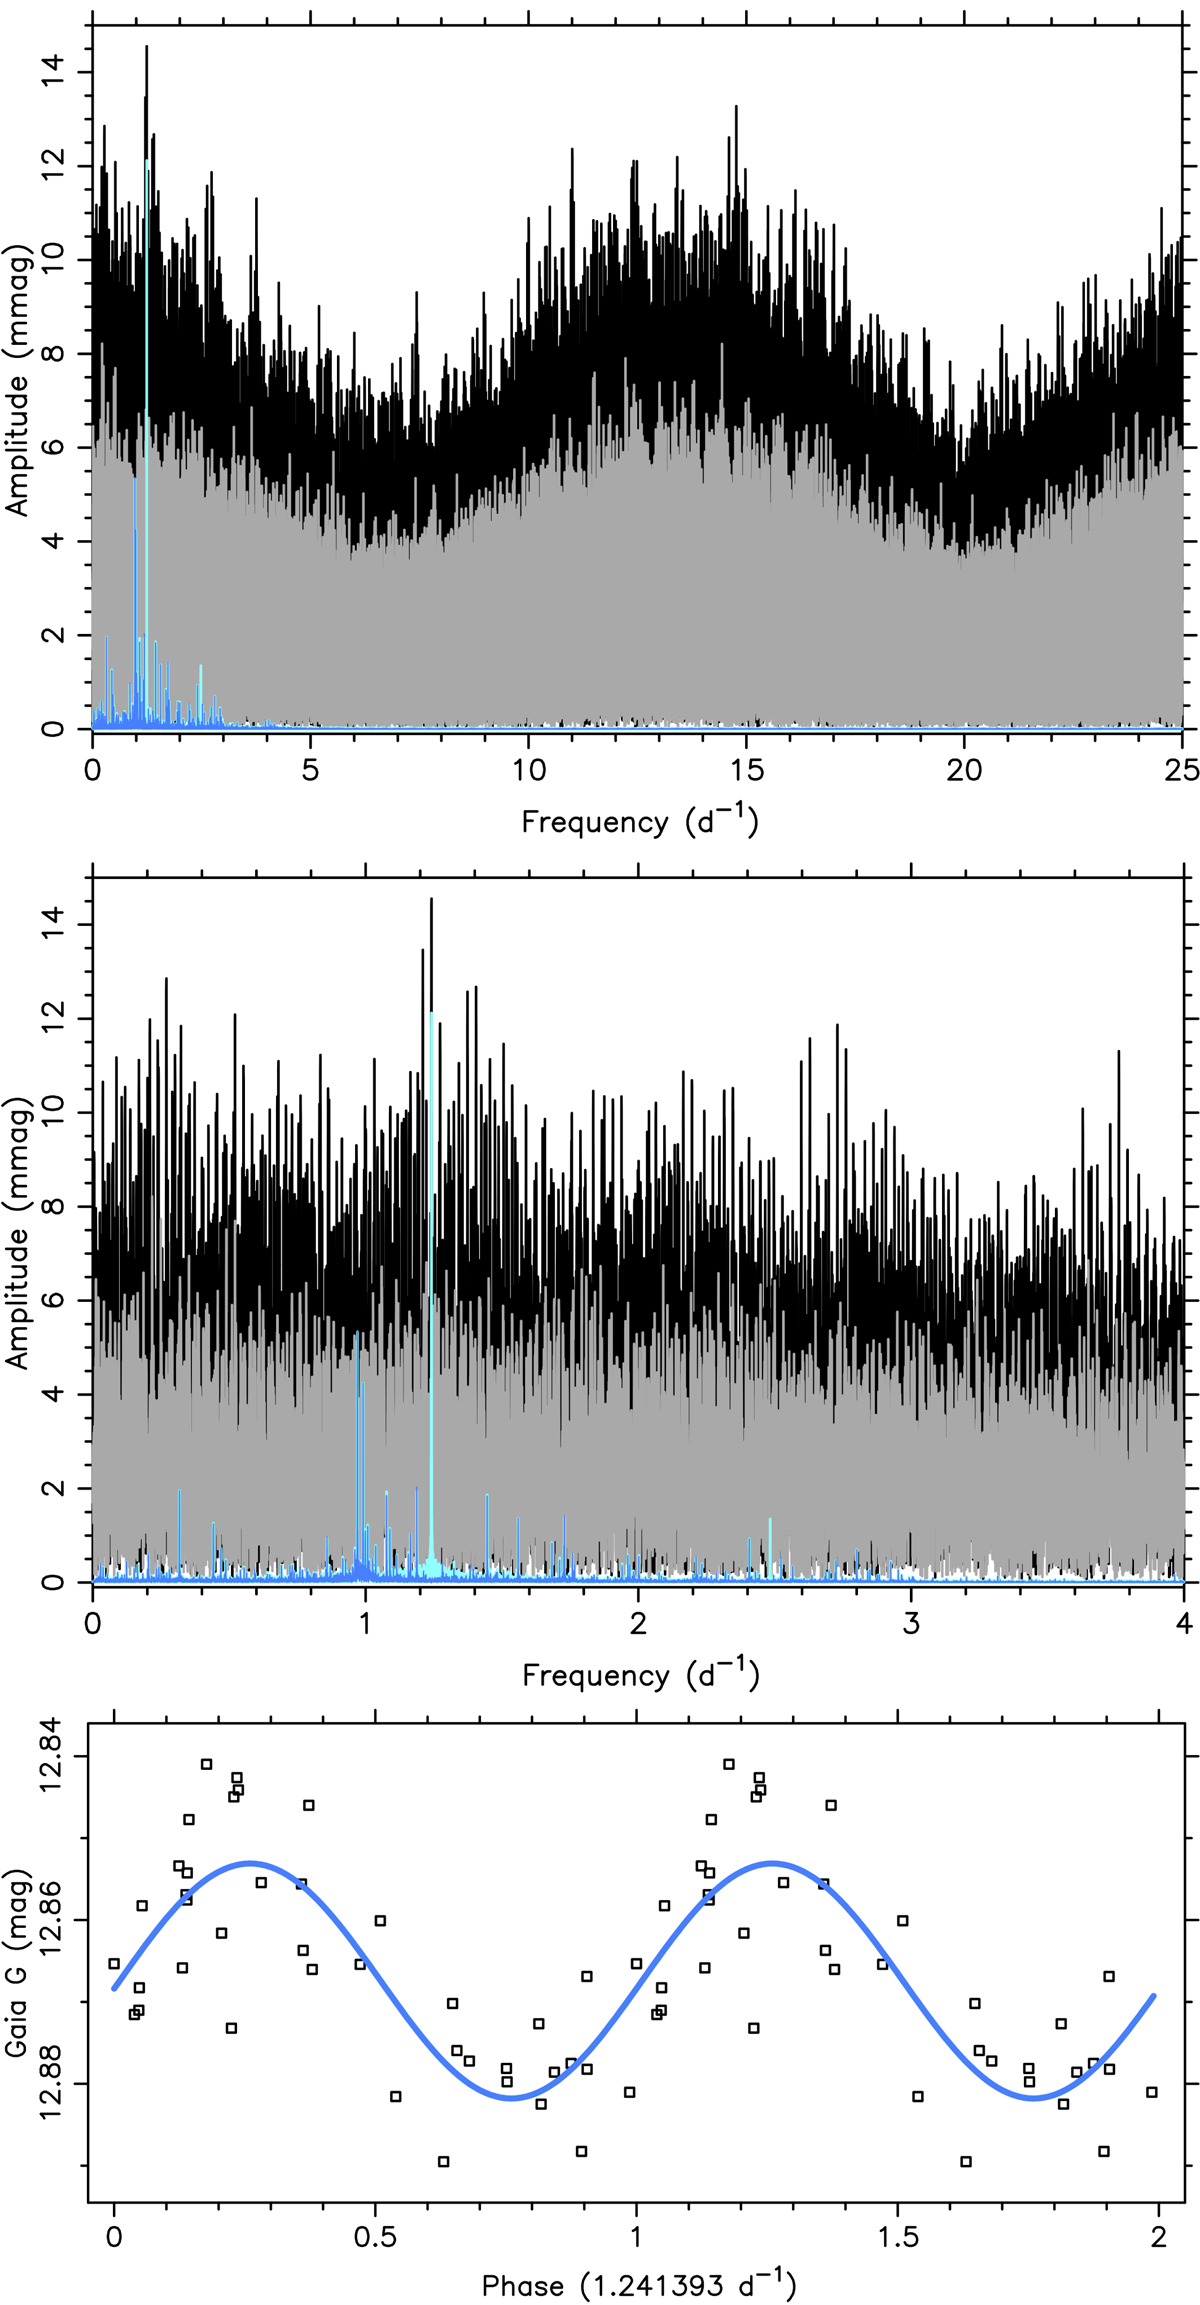
Fig. B.3.
Download original image
Four Lomb-Scargle periodograms (upper: full frequency range; middle; zoomed version) of the γ Dor star KIC 11080103. The black and cyan curves stand for the Gaia DR3 G-band and Kepler light curves, respectively. The grey and blue periodograms result from prewhitening the Gaia G and Kepler data with the dominant frequency. The lower panel shows the Gaia DR3 G-band data (black squares) folded with the dominant frequency detected in common in both light curves; a harmonic fit with that frequency is overplotted (full blue line). For visibility purposes, the phase is shown for two cycles.
Current usage metrics show cumulative count of Article Views (full-text article views including HTML views, PDF and ePub downloads, according to the available data) and Abstracts Views on Vision4Press platform.
Data correspond to usage on the plateform after 2015. The current usage metrics is available 48-96 hours after online publication and is updated daily on week days.
Initial download of the metrics may take a while.