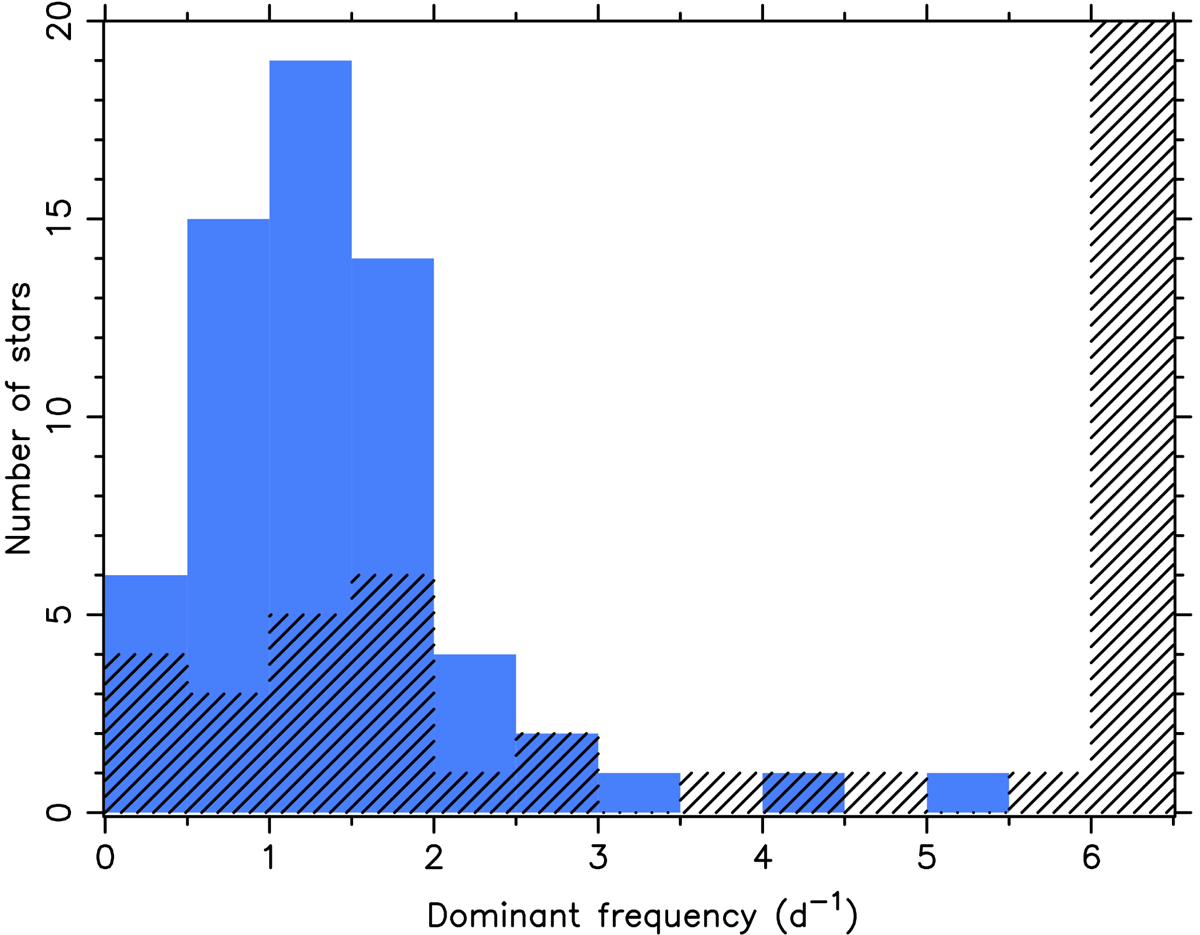
Fig. B.1.
Download original image
Histogram of the dominant frequency in the Kepler light curves of 63 asteroseismically modelled g-mode pulsators (blue) compared with the dominant frequency occurring in their Gaia DR3 G-band epoch photometry (black hatched). For reasons of visibility, the x−axis is cut at 6.5 d−1 and the y−axis at 20; 38 of the 63 g-mode pulsators have their Gaia data dominated by instrumental effects with dominant frequency above 6 d−1 rather than by their g modes.
Current usage metrics show cumulative count of Article Views (full-text article views including HTML views, PDF and ePub downloads, according to the available data) and Abstracts Views on Vision4Press platform.
Data correspond to usage on the plateform after 2015. The current usage metrics is available 48-96 hours after online publication and is updated daily on week days.
Initial download of the metrics may take a while.