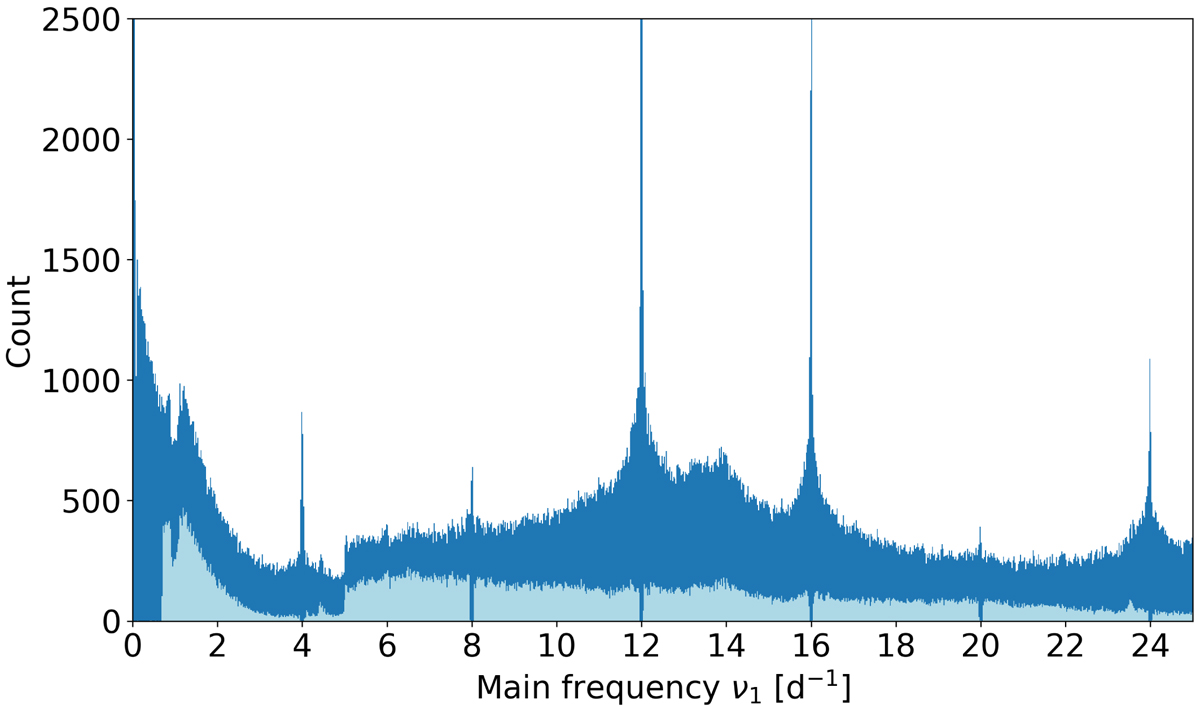
Fig. 1.
Download original image
A histogram of the first frequency ν1. Dark blue: histogram of the first frequency ν1 of the 460 519 candidate main sequence variables. The highest peaks go beyond the maximum value of the y-axis. Light blue: Same histogram for the 108 663 for which we filtered on the primary frequency ν1 and its corresponding FAP value to avoid instrumental artefacts. Because of the 34-month time-span of the DR3 time series, the typical uncertainty on the frequency is about 10−3 d−1.
Current usage metrics show cumulative count of Article Views (full-text article views including HTML views, PDF and ePub downloads, according to the available data) and Abstracts Views on Vision4Press platform.
Data correspond to usage on the plateform after 2015. The current usage metrics is available 48-96 hours after online publication and is updated daily on week days.
Initial download of the metrics may take a while.