Open Access
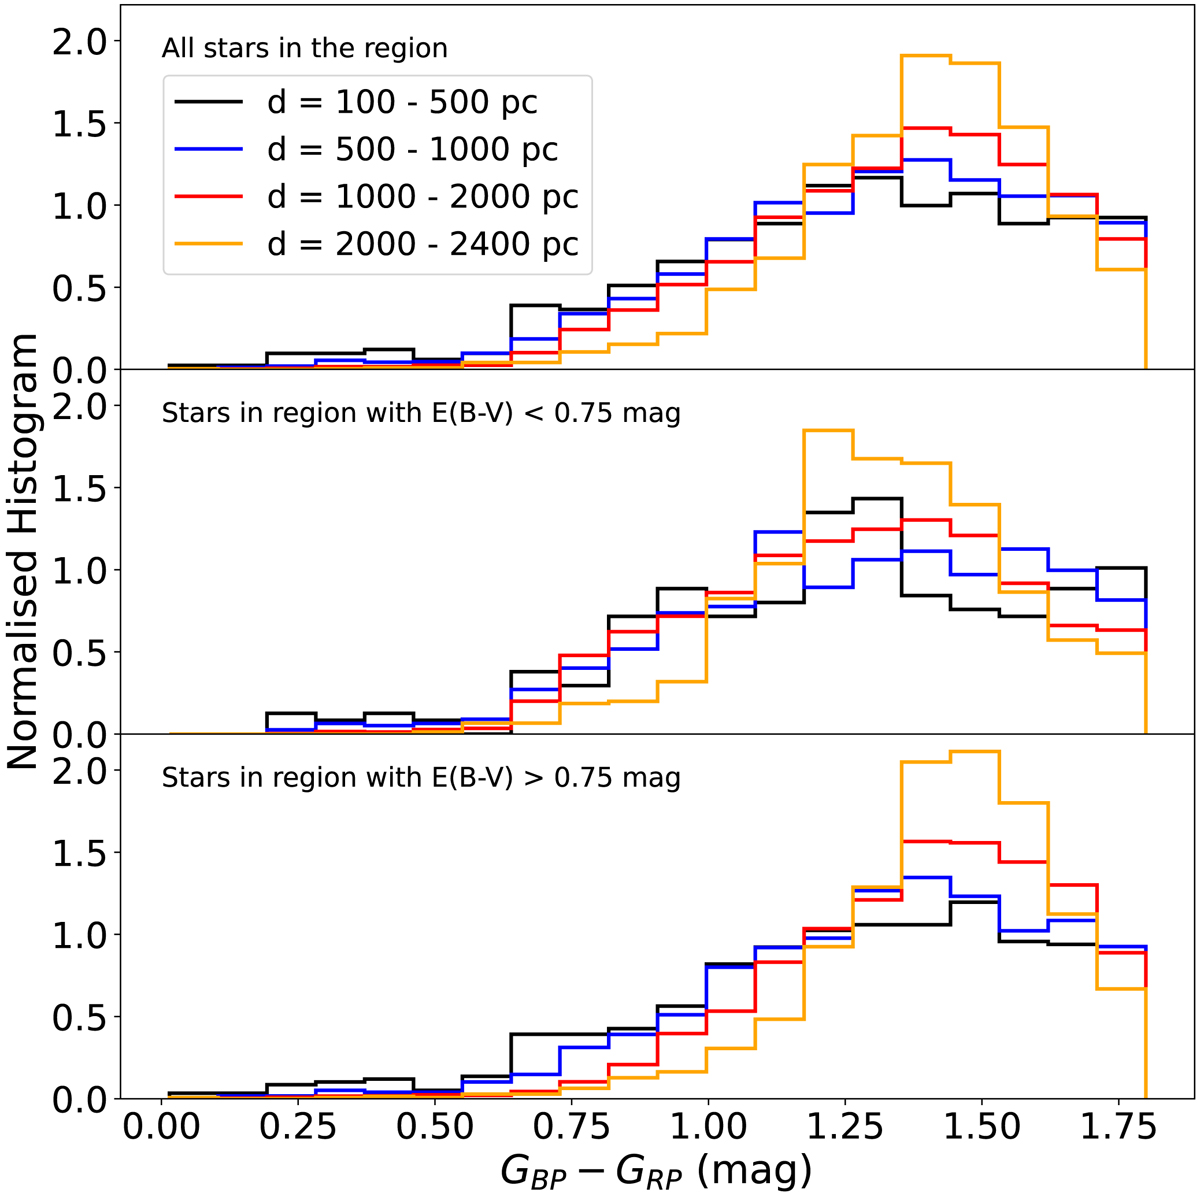
Fig. 9.
Download original image
Normalised number histogram of stars as a function of (GBP−GRP) for each distance sub-sample. (a) All the Gaia stars in the region of the cluster, (b) Gaia stars which fall in the regions where there is less extinction (E(B − V) < 0.75 mag) (c) Gaia stars which fall in more extincted region (E(B − V) > 0.75 mag).
Current usage metrics show cumulative count of Article Views (full-text article views including HTML views, PDF and ePub downloads, according to the available data) and Abstracts Views on Vision4Press platform.
Data correspond to usage on the plateform after 2015. The current usage metrics is available 48-96 hours after online publication and is updated daily on week days.
Initial download of the metrics may take a while.