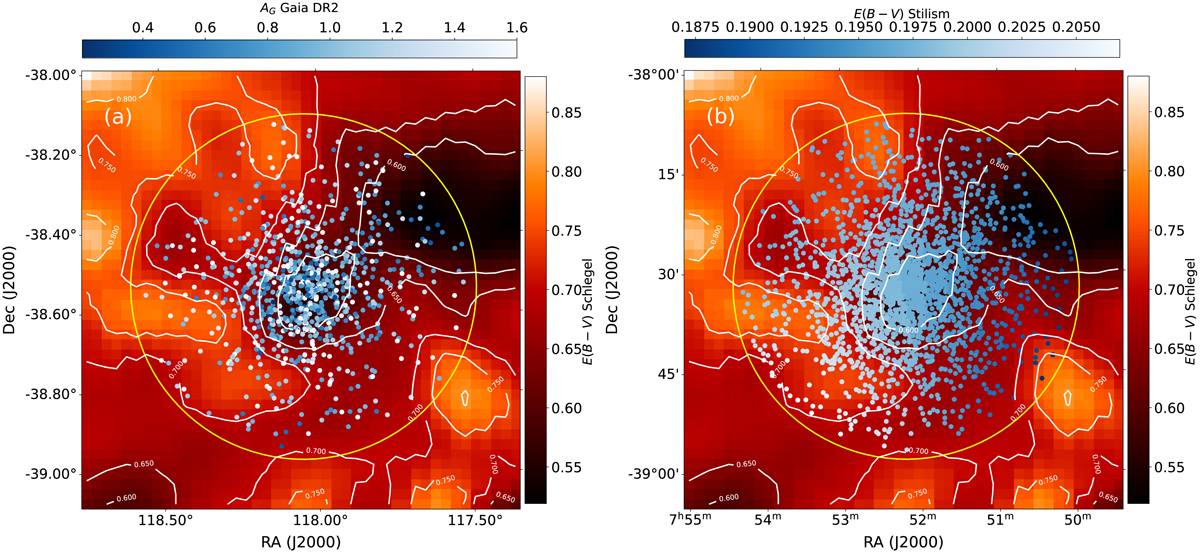
Fig. 7.
Download original image
Schlegel et al. (1998) 2D reddening map for the cluster. The contour levels are 0.65, 0.75, 0.8, 0.85, and 0.9 mag in E(B − V). The yellow circle represents the extent of the cluster. (a) Overplotted are the stars with measured AG values (838 stars) from Gaia DR2. (b) Distribution of E(B−V) across the cluster from Lallement et al. (2018).
Current usage metrics show cumulative count of Article Views (full-text article views including HTML views, PDF and ePub downloads, according to the available data) and Abstracts Views on Vision4Press platform.
Data correspond to usage on the plateform after 2015. The current usage metrics is available 48-96 hours after online publication and is updated daily on week days.
Initial download of the metrics may take a while.