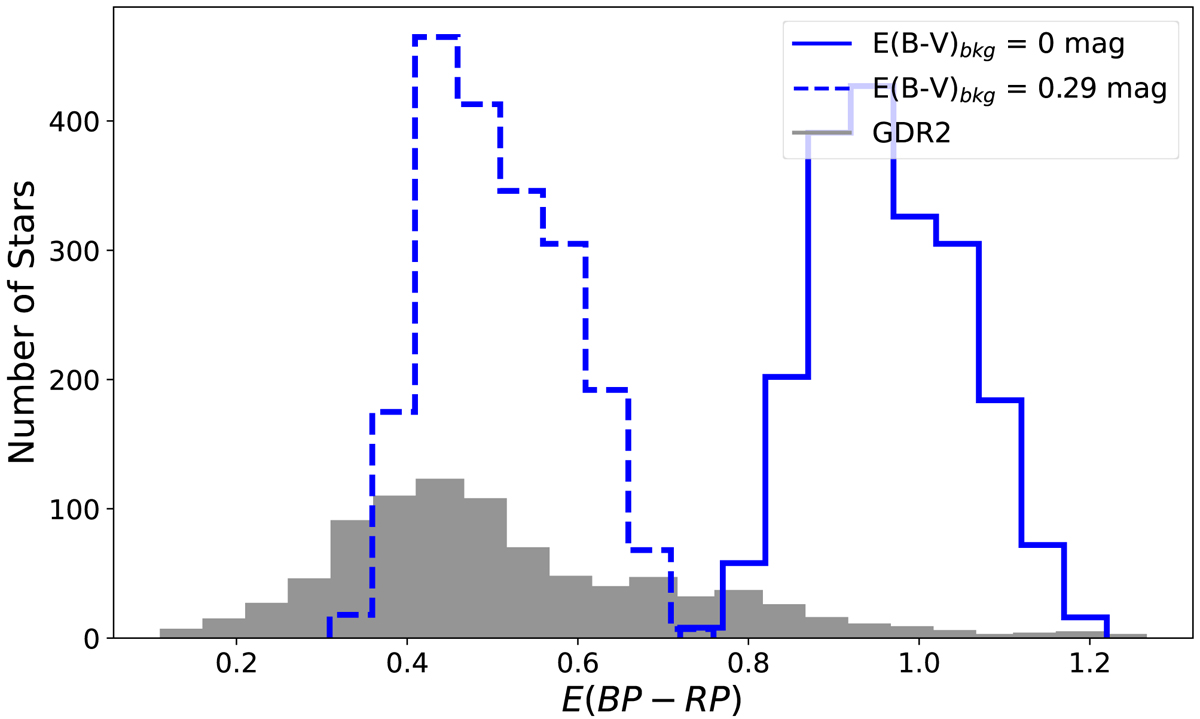
Fig. 6.
Download original image
Distribution of the calculated and measured E(BP−RP). The filled grey histogram shows the measured E(BP−RP) values from GDR2. The distribution of calculated E(BP−RP) values using Eq. (1) with X = (GBP − GRP)0 and adopting E(B−V) from the SFD map are shown as blue histograms, with (dashed) and without (solid) a correction of the background reddening, see Sect. 3.4 for details.
Current usage metrics show cumulative count of Article Views (full-text article views including HTML views, PDF and ePub downloads, according to the available data) and Abstracts Views on Vision4Press platform.
Data correspond to usage on the plateform after 2015. The current usage metrics is available 48-96 hours after online publication and is updated daily on week days.
Initial download of the metrics may take a while.