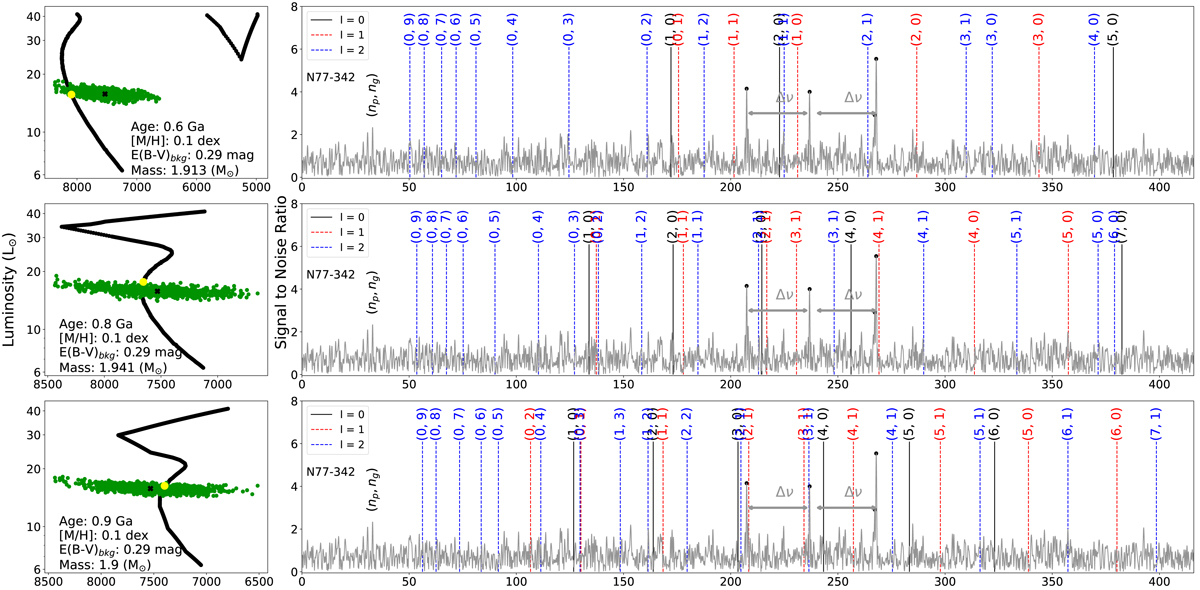
Fig. 18.
Download original image
Left: isochrone tracks (black) with ages of 0.6, 0.8, and 0.9 Ga with [M/H] = 0.1 dex and E(B−V)bkg = 0.29 mag. The LT error for the star N77-342 is shown as the green points that intersect the isochrones, with the central position indicated by the black cross. The best-fitted model is indicated by the yellow filled circle. Right: observed oscillation spectrum (grey) for the star N77-342. The black dots over the observed peaks indicate the observed frequencies with fdet > 0.99. Theoretical frequencies corresponding to the best-fitted model (yellow dot on the left panel) are overplotted in each of the panels. The angular degree and the radial order of each theoretical frequency is also indicated above each frequency and is also colour-coded by the angular degree.
Current usage metrics show cumulative count of Article Views (full-text article views including HTML views, PDF and ePub downloads, according to the available data) and Abstracts Views on Vision4Press platform.
Data correspond to usage on the plateform after 2015. The current usage metrics is available 48-96 hours after online publication and is updated daily on week days.
Initial download of the metrics may take a while.