Fig. 8.
Download original image
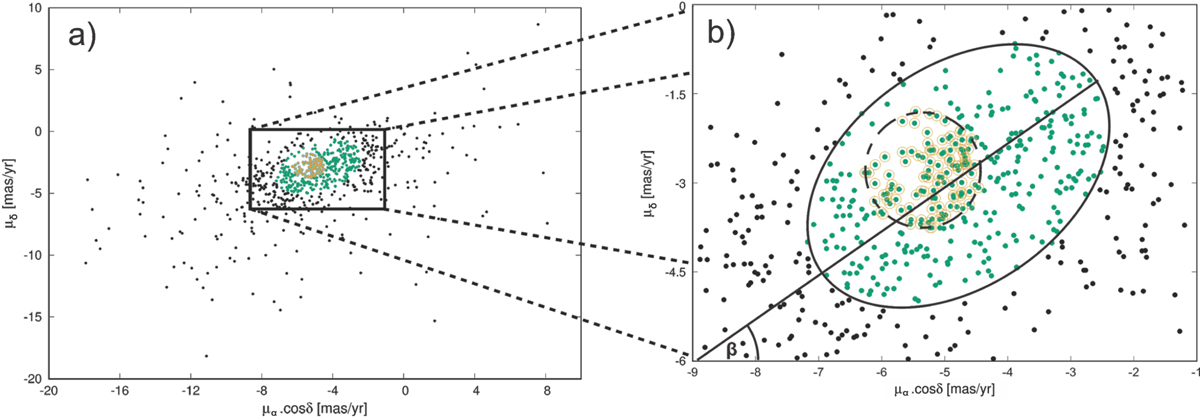
VPD of the 754 stars studied using astrometric Gaia data. Panel (b) presents a zoomed-in view of the central part of panel (a). The ellipse and the slashed circle represent the enclosed curves for the selected objects for the field and cluster populations, respectively (see Sect. 3.2.2). Green dots are the 353 stars selected from the Gaia EDR3 catalog and the yellow hollow symbols represent the 110 possible members obtained in this paper.
Current usage metrics show cumulative count of Article Views (full-text article views including HTML views, PDF and ePub downloads, according to the available data) and Abstracts Views on Vision4Press platform.
Data correspond to usage on the plateform after 2015. The current usage metrics is available 48-96 hours after online publication and is updated daily on week days.
Initial download of the metrics may take a while.