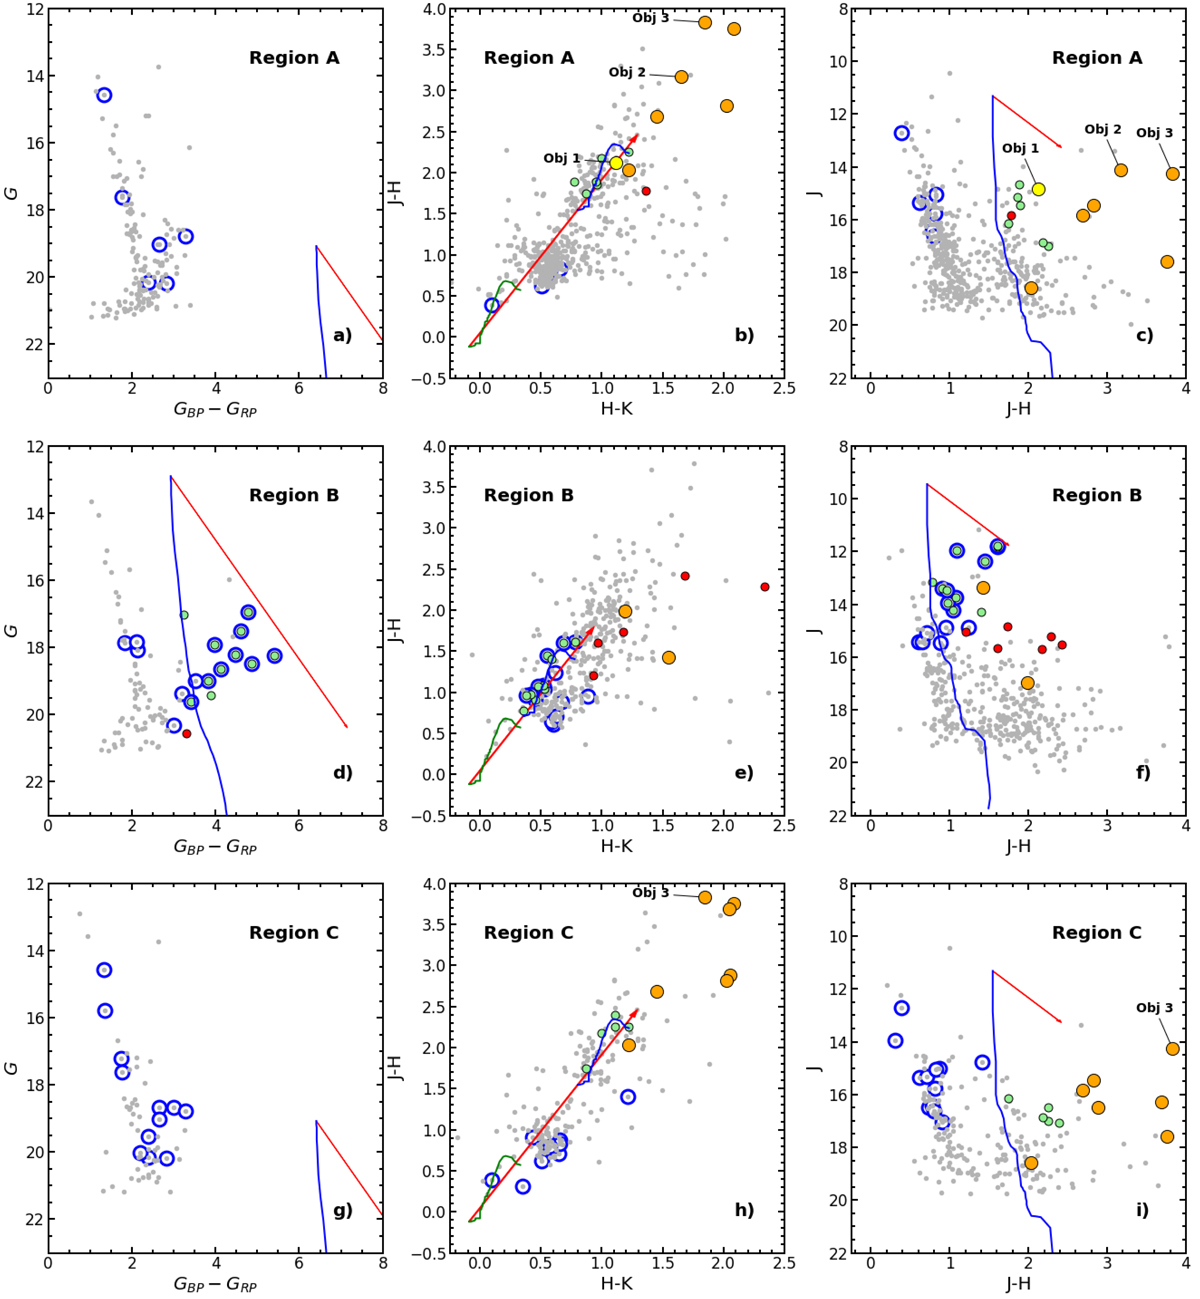
Fig. 7.
Download original image
Gaia and IR photometric diagrams for Regions A, B, and C. Symbols have same meaning as in Fig. 2, but in this case hollow blue circles correspond to objects in Table C.1. Light gray circles indicate unclassified stars and most of them are field population stars (See Sect. 3.2.1 for details). Particular objects described in Sect. 4.3 are identified. Green and blue curves are the MS (see text) shifted according to the adopted distance modulus with and without absorption and reddening, respectively. Red lines indicate the considered reddening path. Adopted reddening values for Regions A and C and Region B are those presented in Table 5 for DBS 90−91 and DBS 89, respectively.
Current usage metrics show cumulative count of Article Views (full-text article views including HTML views, PDF and ePub downloads, according to the available data) and Abstracts Views on Vision4Press platform.
Data correspond to usage on the plateform after 2015. The current usage metrics is available 48-96 hours after online publication and is updated daily on week days.
Initial download of the metrics may take a while.