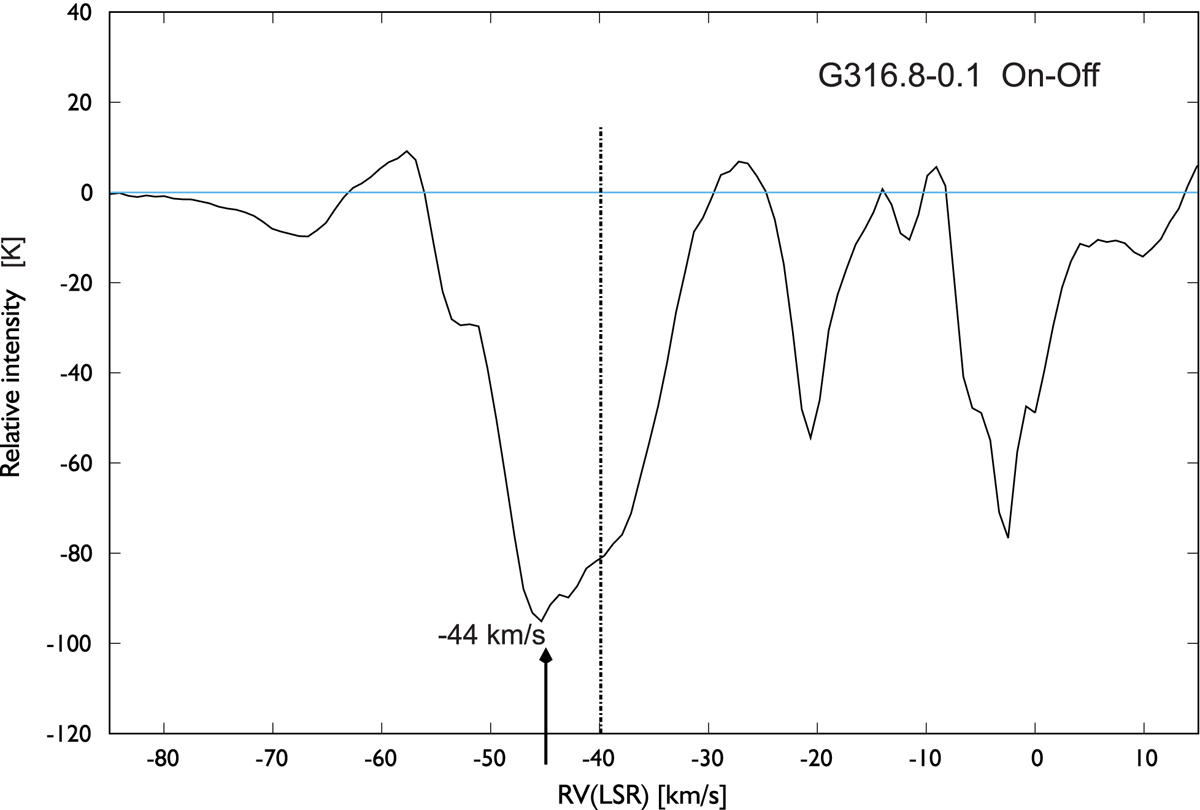
Fig. 6.
Download original image
Relative intensity of the G316.8−0.1 (“on-source”) subtracted from the average of three sources of its environment (“off-source”). Higher-intensity absorption would indicate the location of the H II region. The vertical line at −40 km s−1 shows the velocity of the 13CO (1−0) molecular line (emission) detected with the MSX survey by Busfield et al. (2006). The horizontal light blue line shows the zero value from which the absorption intensity is measured.
Current usage metrics show cumulative count of Article Views (full-text article views including HTML views, PDF and ePub downloads, according to the available data) and Abstracts Views on Vision4Press platform.
Data correspond to usage on the plateform after 2015. The current usage metrics is available 48-96 hours after online publication and is updated daily on week days.
Initial download of the metrics may take a while.