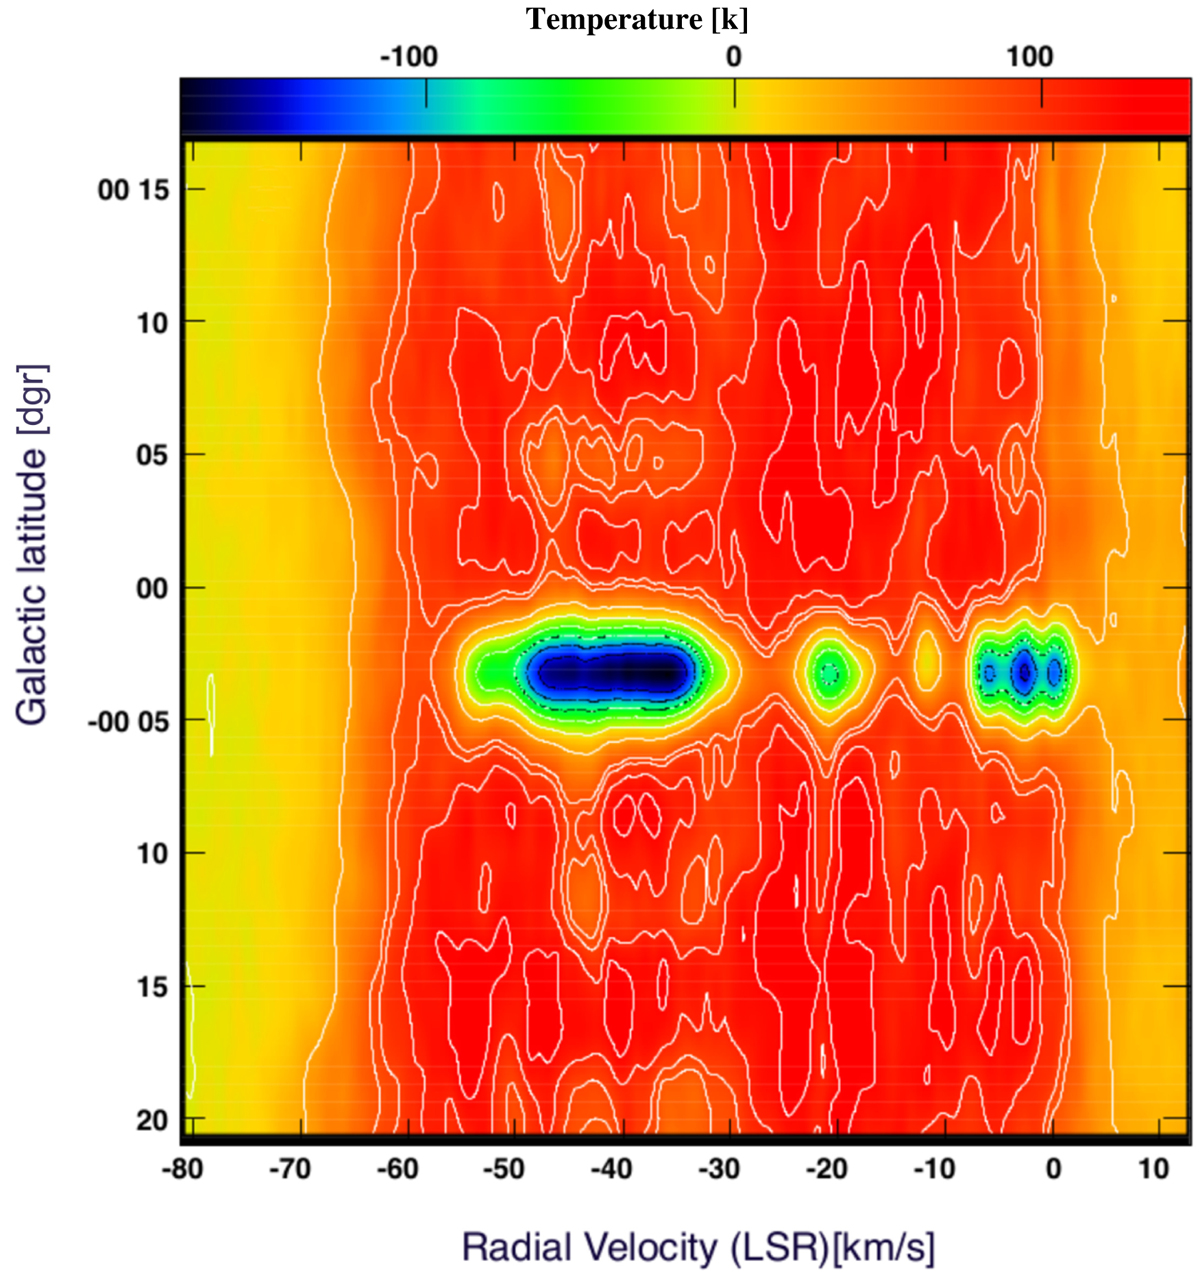
Fig. 3.
Download original image
Radio image at 21 cm (SGPS) of the H I emission distribution of the G316.8−0.1 radio source (l ∼ 317°). H I absorption in the line of sight is indicated in blue and green. Contours have a spacing of 28 K, with the first being at −78 K. The color bar shows the colors associated with different H I brightness temperature values in Kelvin.
Current usage metrics show cumulative count of Article Views (full-text article views including HTML views, PDF and ePub downloads, according to the available data) and Abstracts Views on Vision4Press platform.
Data correspond to usage on the plateform after 2015. The current usage metrics is available 48-96 hours after online publication and is updated daily on week days.
Initial download of the metrics may take a while.