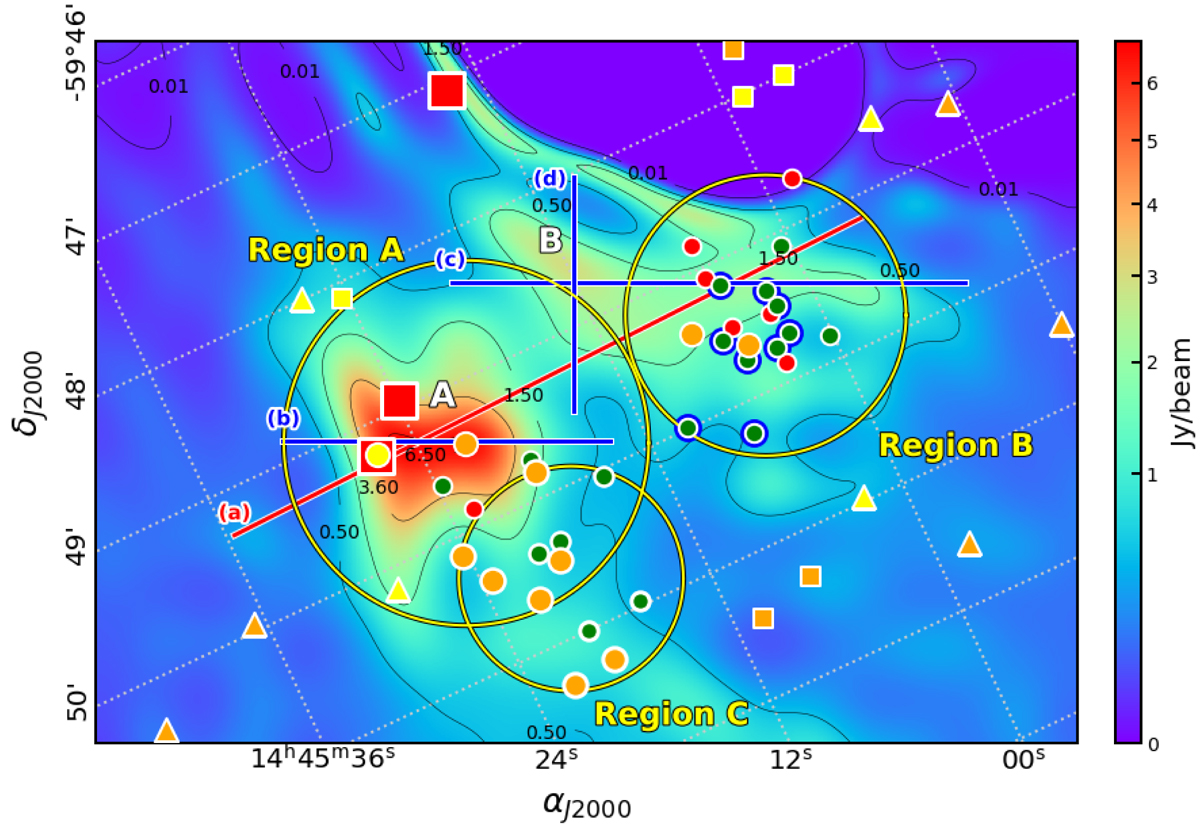
Fig. 2.

Download original image
Deconvolved radio continuum image at 843 MHz (SUMSS) of the same size and center as Fig. 1. Selected regions A, B, and C (see Sect. 3.2.1) are indicated by large yellow circles. Red and blue lines show the section, extension, and inclination of the cuts made in different parts of the H II region. Symbols indicate the identified members in each studied region and identified YSOs in the surrounding neighborhood. Green symbols correspond to MS stars and red ones to stars with a probable IR excess. Yellow and orange symbols indicate Class I and II YSOs, respectively. Circles correspond to those identified using K band and WISE data, triangles those using only WISE data, and squares those identified using GLIMPSE data. Large red squares indicate objects listed in Table B.3. Green symbols with blue edges are the astrophotometric members presented in Table C.2.
Current usage metrics show cumulative count of Article Views (full-text article views including HTML views, PDF and ePub downloads, according to the available data) and Abstracts Views on Vision4Press platform.
Data correspond to usage on the plateform after 2015. The current usage metrics is available 48-96 hours after online publication and is updated daily on week days.
Initial download of the metrics may take a while.


