Fig. 11.
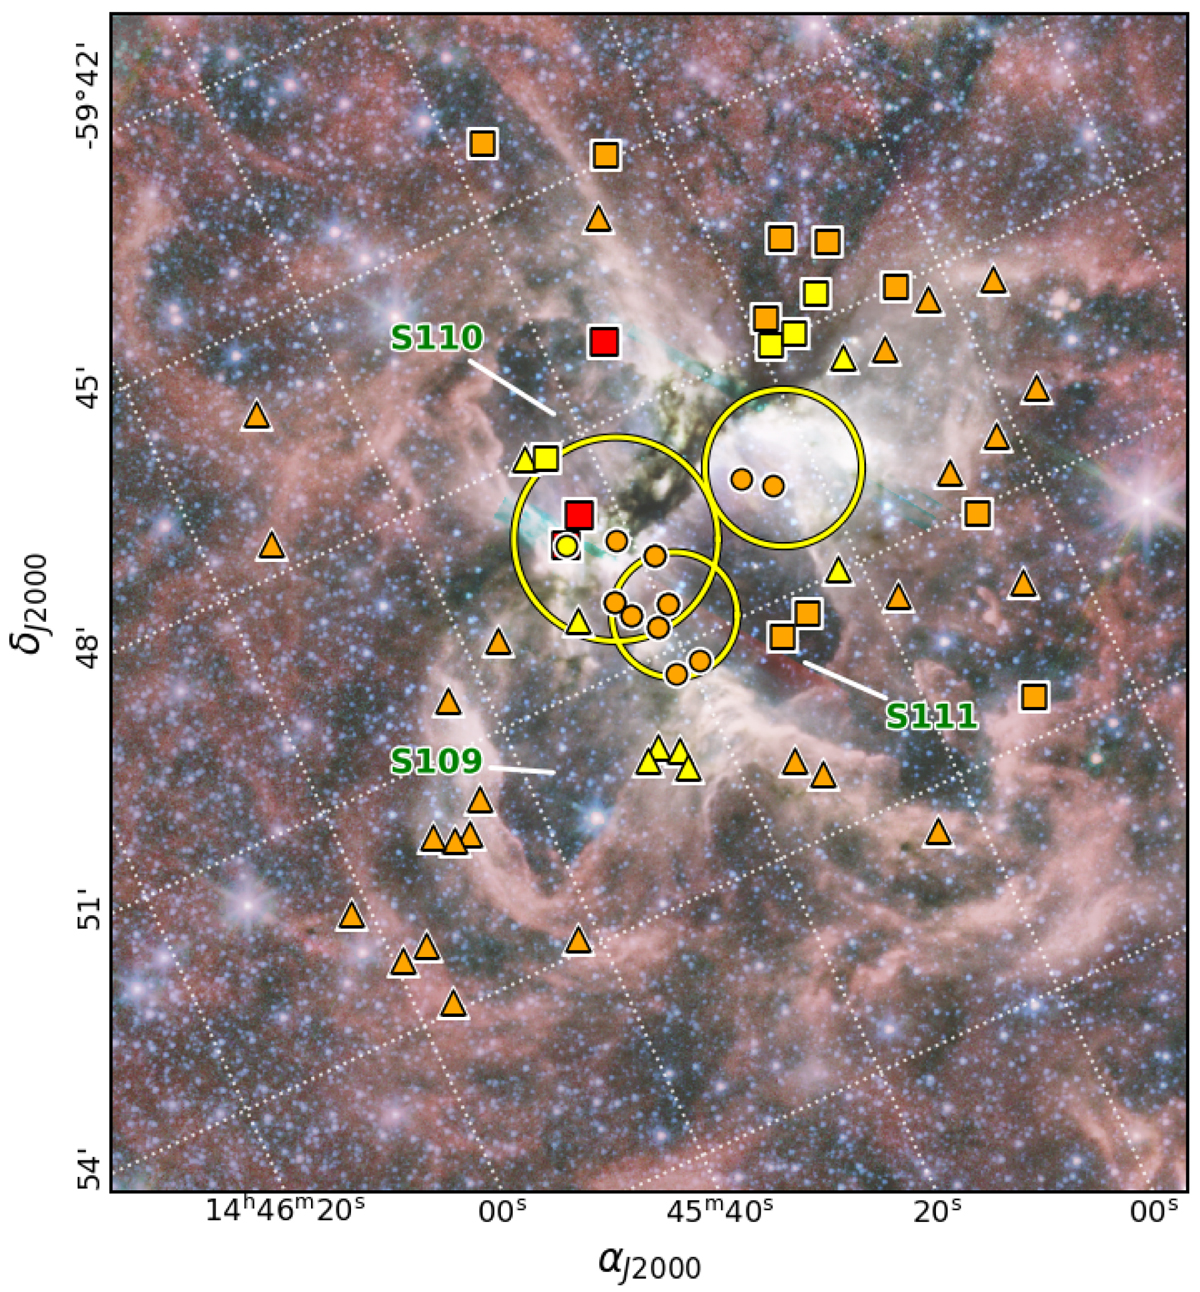
Download original image
Spitzer color image centered on the G316.8−0.1 radio source (ch1 = violet, ch2 = cian, ch3 = yellow, ch4 = red). Large yellow hollow circles indicate Regions A, B, and C presented in Fig. 1. Symbols are YSOs as presented in Fig. 2. Yellow and orange symbols indicate Class I and II YSOs, respectively. Circles correspond to those identified using K band and WISE data, triangles those using only WISE data, and squares using GLIMPSE data. Big red squares indicate objects listed in Table B.3. Bubbles S109, S110, and S111 presented by Churchwell et al. (2006) are identified.
Current usage metrics show cumulative count of Article Views (full-text article views including HTML views, PDF and ePub downloads, according to the available data) and Abstracts Views on Vision4Press platform.
Data correspond to usage on the plateform after 2015. The current usage metrics is available 48-96 hours after online publication and is updated daily on week days.
Initial download of the metrics may take a while.