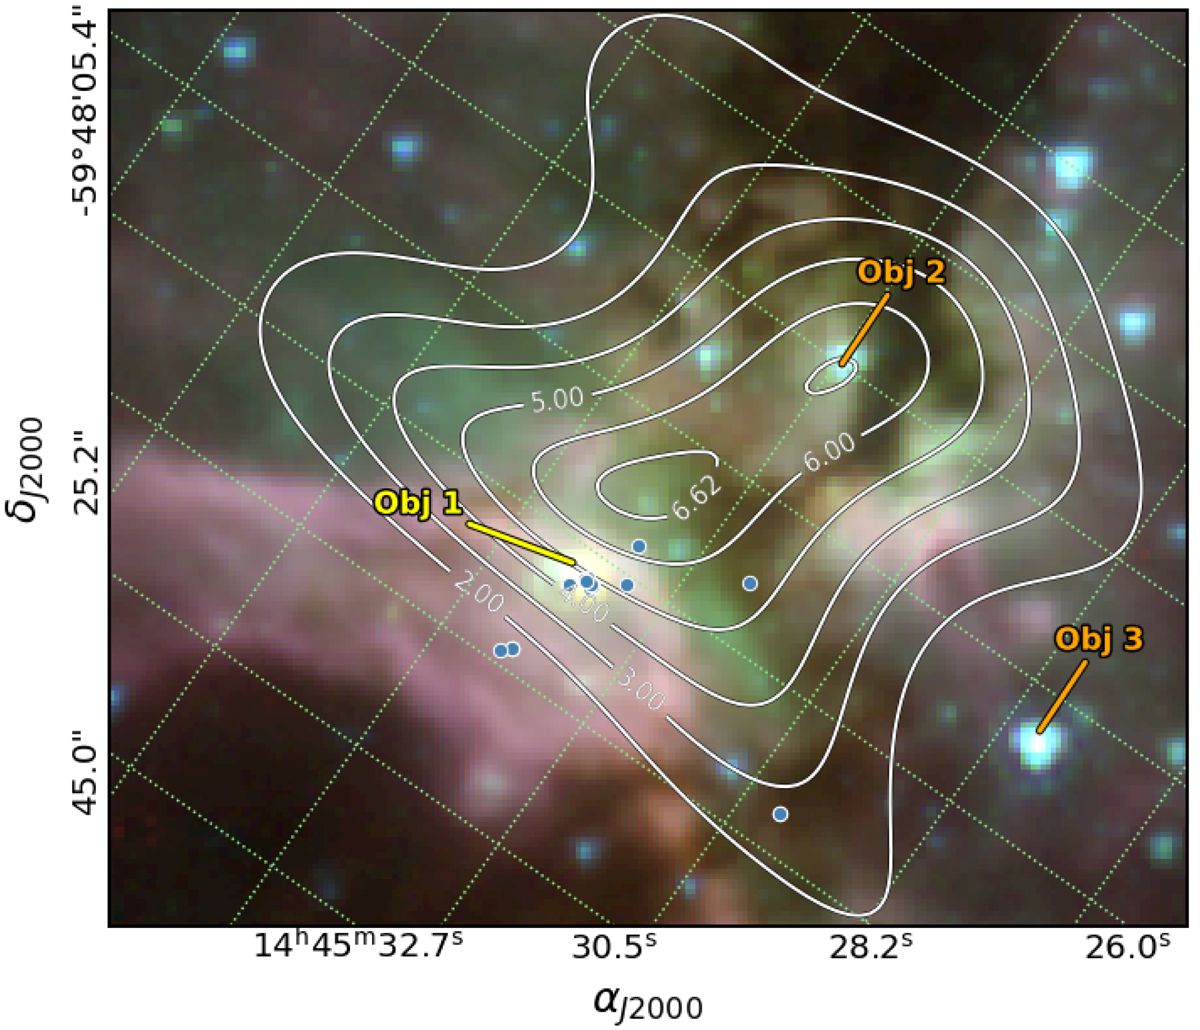
Fig. 10.
Download original image
Spitzer color image at the core of the radio source G316.8−0.1−A (ch1 = blue, ch2 = green, ch3 = red), showing the three particular objects described in Sect. 4.3. Light blue symbols indicate masers given by Dalgleish et al. (2018). White curves are radio continuum flux levels at 843 MHz (deconvolved SUMSS) revealing the presence of a double peak.
Current usage metrics show cumulative count of Article Views (full-text article views including HTML views, PDF and ePub downloads, according to the available data) and Abstracts Views on Vision4Press platform.
Data correspond to usage on the plateform after 2015. The current usage metrics is available 48-96 hours after online publication and is updated daily on week days.
Initial download of the metrics may take a while.