Fig. 1.
Download original image
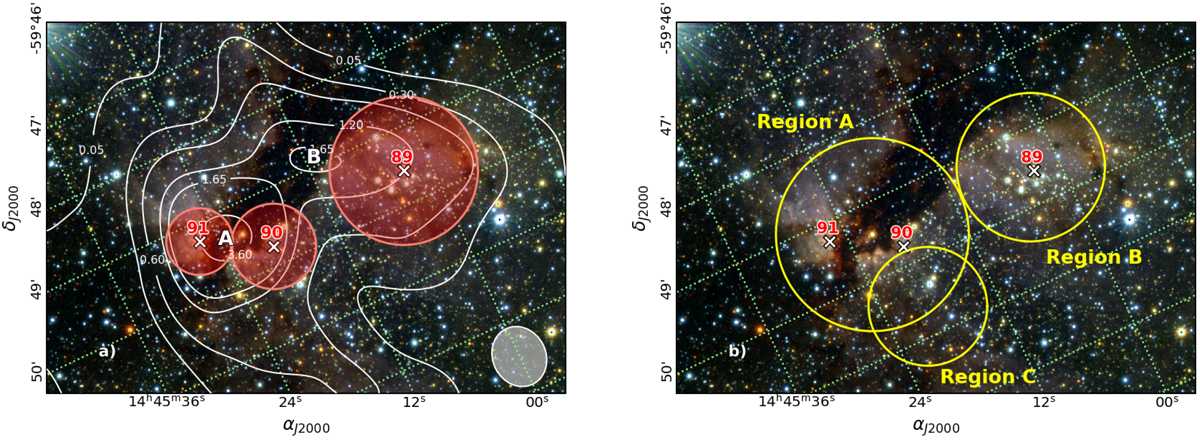
JHK false−color VVV image of 7′×5′ size and centered at αJ2000 = 14 : 45:12.2, δJ2000 = −59:49:27.6. a) White curves are radio continuum flux levels at 843 MHz (SUMSS) revealing the presence of two peaks “A” and “B” of G316.8−0.1 radio source and identified by Vig et al. (2007). The white ellipse at the right-bottom corner indicates the corresponding radio beam size. Red circles represent the locations and mean sizes given by Dutra et al. (2003) for embedded clusters DBS 89−90−91. b) Yellow circles indicate the adopted “Region A”, “Region B”, and “Region C” used along our work to study different stellar populations (see Sects. 3.2.1 and 3.2.2 for details). These regions were used to build the photometric diagrams showed in Fig. 7. Centers for DBS 89−90−91 clusters are presented with white crosses.
Current usage metrics show cumulative count of Article Views (full-text article views including HTML views, PDF and ePub downloads, according to the available data) and Abstracts Views on Vision4Press platform.
Data correspond to usage on the plateform after 2015. The current usage metrics is available 48-96 hours after online publication and is updated daily on week days.
Initial download of the metrics may take a while.