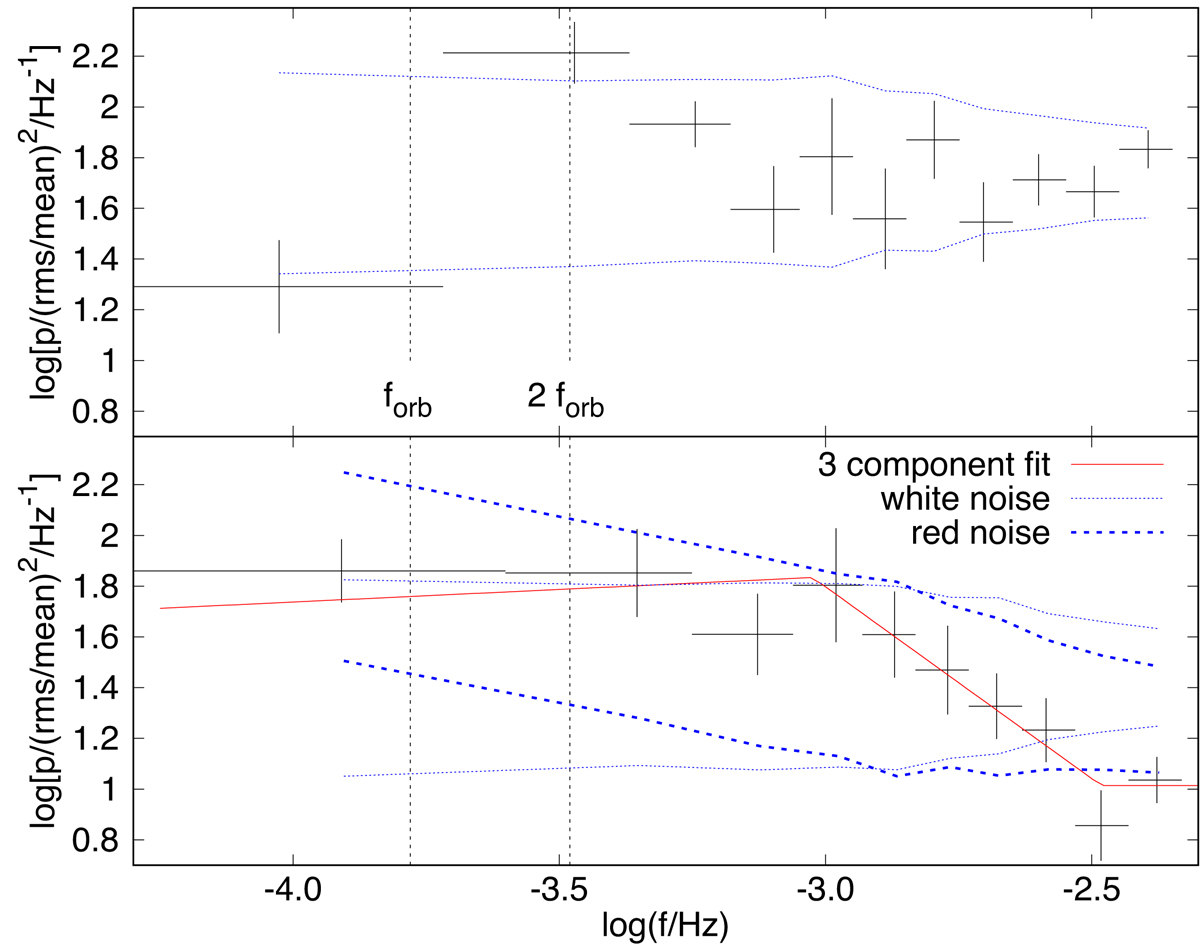
Fig. 4.
Download original image
PDSs calculated from combined EPIC light curves from first (upper panel) and second (lower panel) part of the data. Crosses are the mean values of the PDS power at a mean frequency of every bin. The error bars represent bin widths and errors of the mean. Vertical dotted lines show the orbital frequency, forb, and its first harmonics. Blue lines represent the 2-σ confidence intervals from simulations of noises.
Current usage metrics show cumulative count of Article Views (full-text article views including HTML views, PDF and ePub downloads, according to the available data) and Abstracts Views on Vision4Press platform.
Data correspond to usage on the plateform after 2015. The current usage metrics is available 48-96 hours after online publication and is updated daily on week days.
Initial download of the metrics may take a while.