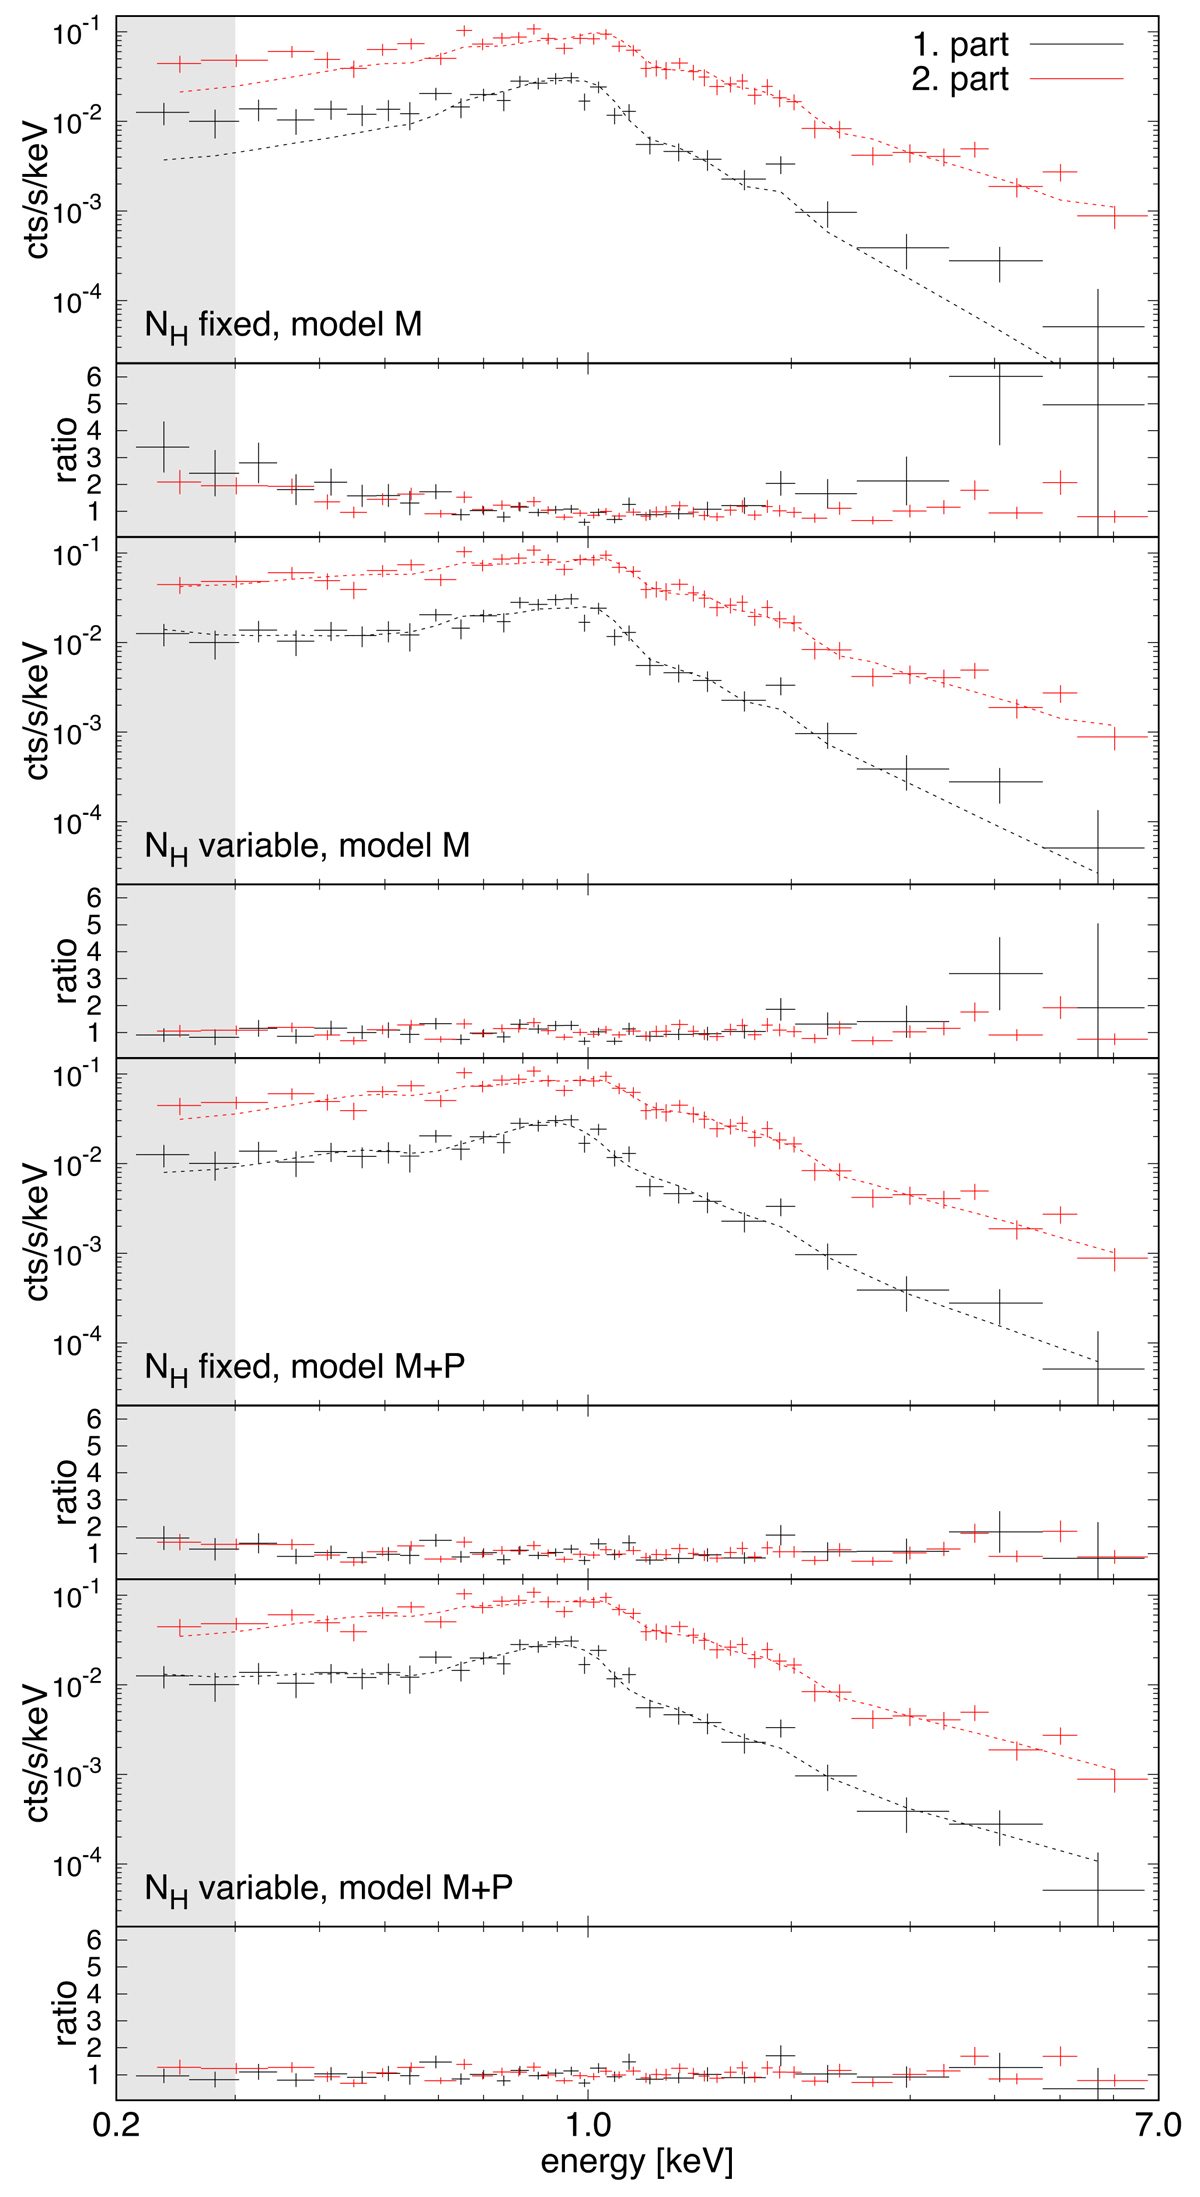
Fig. 3.
Download original image
EPIC pn spectra from different parts of the pn light curve with corresponding fits and ratios between data and fitted model. Parts 1 and 2 represent low and high flux portion of the data, respectively. Two models are shown (see text or Table 1 for details). The fits are performed from 0.3 keV and the shaded area represents an extrapolated region.
Current usage metrics show cumulative count of Article Views (full-text article views including HTML views, PDF and ePub downloads, according to the available data) and Abstracts Views on Vision4Press platform.
Data correspond to usage on the plateform after 2015. The current usage metrics is available 48-96 hours after online publication and is updated daily on week days.
Initial download of the metrics may take a while.