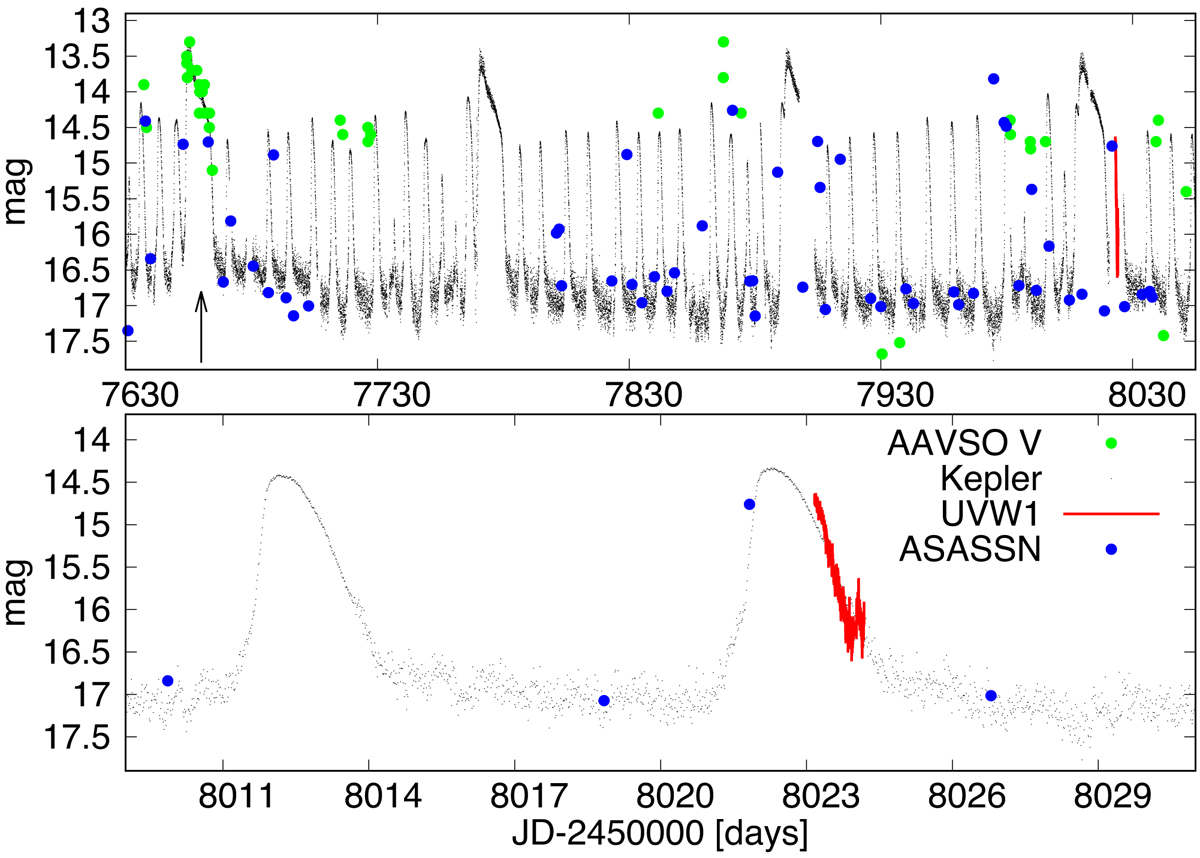
Fig. 2.
Download original image
OM light curve (red solid line) compared to AAVSO and ASAS-SN V data and Kepler magnitudes. In the upper panel, the Kepler light curve is shifted in time by +1775 days in order to superimpose the superoutburst in Kepler and AAVSO data marked by the arrow. In the lower panel, the Kepler data are shifted horizontally by +1800.8 days to compare the OM and ASAS-SN light curve with a randomly selected regular outburst.
Current usage metrics show cumulative count of Article Views (full-text article views including HTML views, PDF and ePub downloads, according to the available data) and Abstracts Views on Vision4Press platform.
Data correspond to usage on the plateform after 2015. The current usage metrics is available 48-96 hours after online publication and is updated daily on week days.
Initial download of the metrics may take a while.