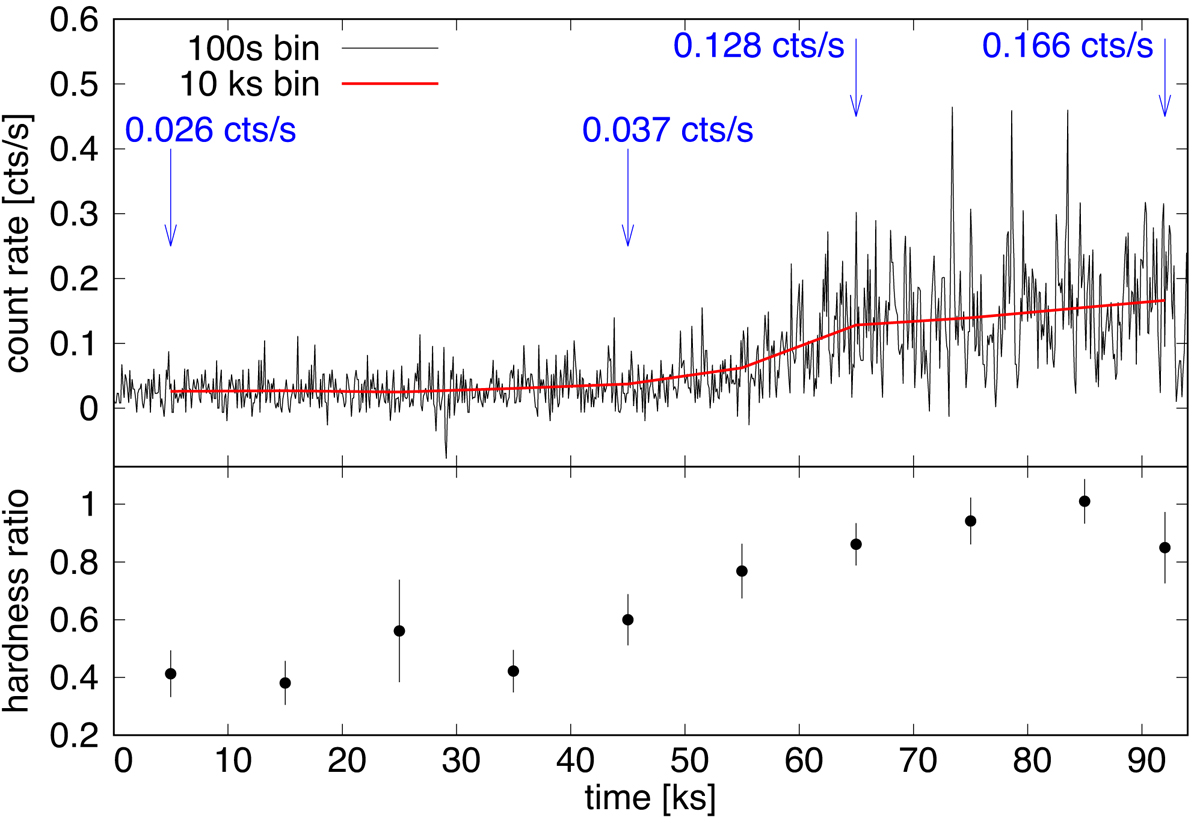
Fig. 1.
Download original image
Light curves and hardness ratio. Upper panel: pn light curve binned into 100 s bins (black solid line) with the long-term flux evolution shown as a low-resolution version of the light curve binned into 10 ks bins (red line). Arrows with labels show the corresponding count rate (in the red line) at selected points where the trend of the low resolution light curve changes. Lower panel: Hardness ratio (1.0–10.0 keV band divided by 0.2–1.0 keV band) calculated from low-resolution light curves binned into 10-ks bins.
Current usage metrics show cumulative count of Article Views (full-text article views including HTML views, PDF and ePub downloads, according to the available data) and Abstracts Views on Vision4Press platform.
Data correspond to usage on the plateform after 2015. The current usage metrics is available 48-96 hours after online publication and is updated daily on week days.
Initial download of the metrics may take a while.