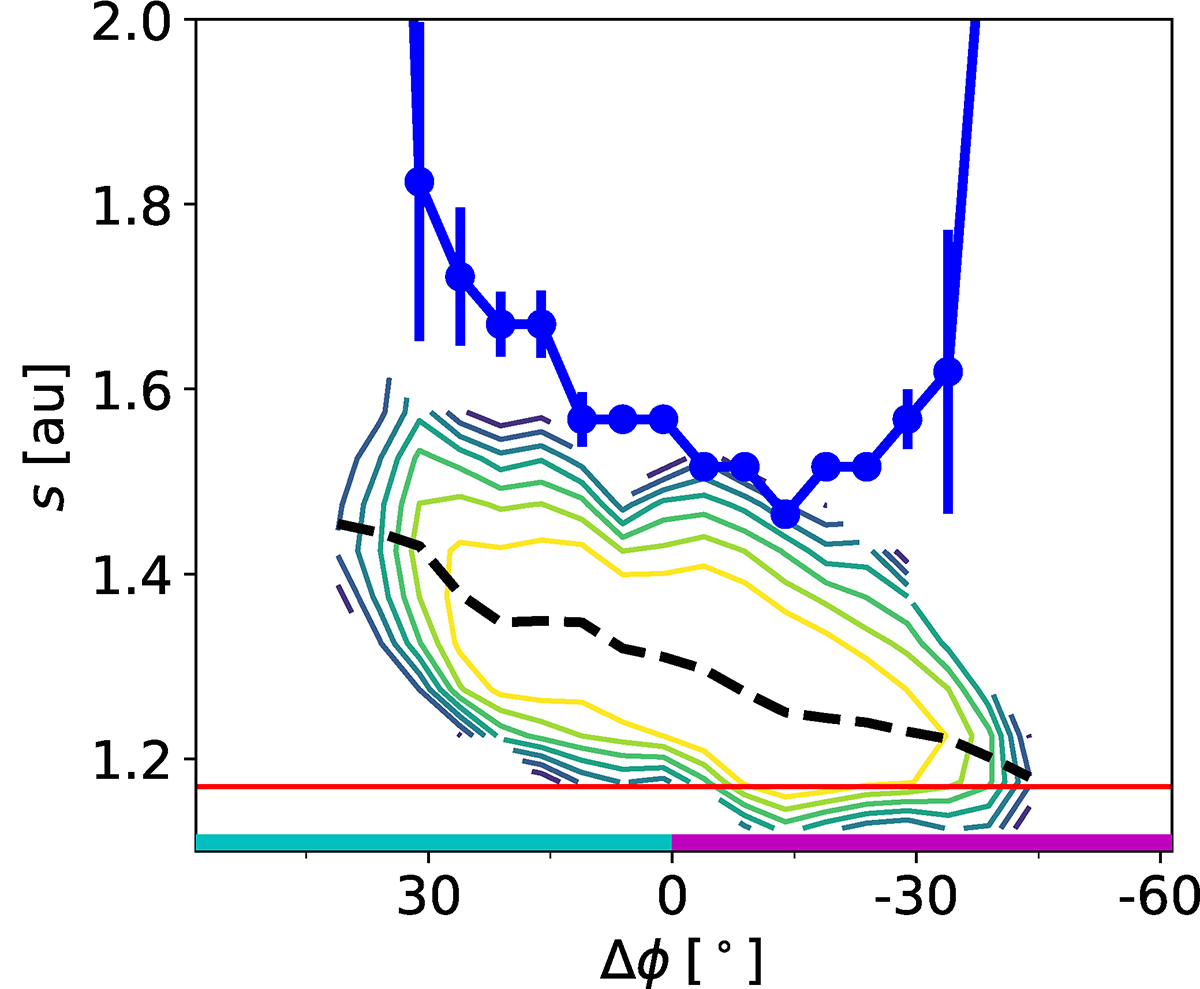
Fig. 3.
Download original image
Path lengths of the first arriving 100-MeV protons (thick blue curve) and the density of field lines (contour lines, spaced at 0.5 orders of magnitude Laitinen et al. 2023) as a function of Δϕ. The arrival times, and hence the path lengths, of the protons are determined as the time when the intensity reaches 1% of the global maximum intensity at 1 au. The dashed black curve shows the mean field line length, and the horizontal red line shows the nominal Parker spiral length. The magenta and cyan ranges at the bottom correspond to those in Fig. 1.
Current usage metrics show cumulative count of Article Views (full-text article views including HTML views, PDF and ePub downloads, according to the available data) and Abstracts Views on Vision4Press platform.
Data correspond to usage on the plateform after 2015. The current usage metrics is available 48-96 hours after online publication and is updated daily on week days.
Initial download of the metrics may take a while.