Fig. E.2.
Download original image
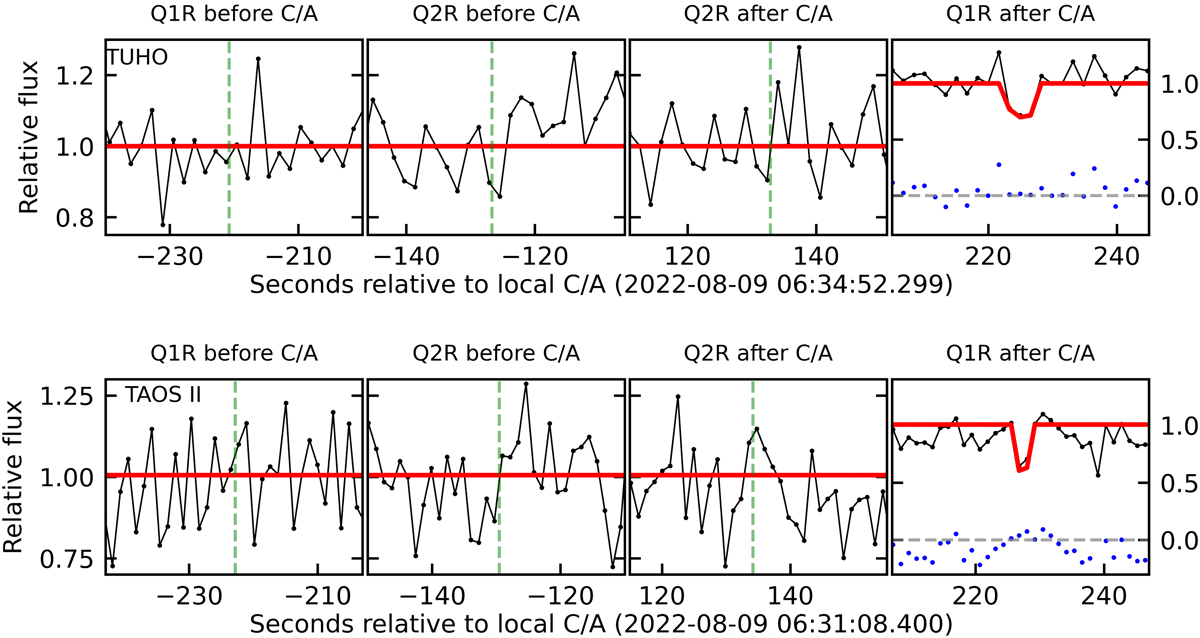
Fits to the Q1R dense ring in light curve data taken with TUHO and TAOS II telescopes, from top to bottom. TAOS II data are stacked every six images. These light curves are plotted as a function of the time in seconds relative to the local closest approach (C/A), with a different y-axis scale in the rightmost panel in each row (dense part of Q1R). The green vertical dashed lines represent the theoretical times for the Q1R and Q2R rings. Note: although marginal, the two data points that detect the Q1R ring in the TAOS II light curve are statistically significant at the 4.2-σ level.
Current usage metrics show cumulative count of Article Views (full-text article views including HTML views, PDF and ePub downloads, according to the available data) and Abstracts Views on Vision4Press platform.
Data correspond to usage on the plateform after 2015. The current usage metrics is available 48-96 hours after online publication and is updated daily on week days.
Initial download of the metrics may take a while.