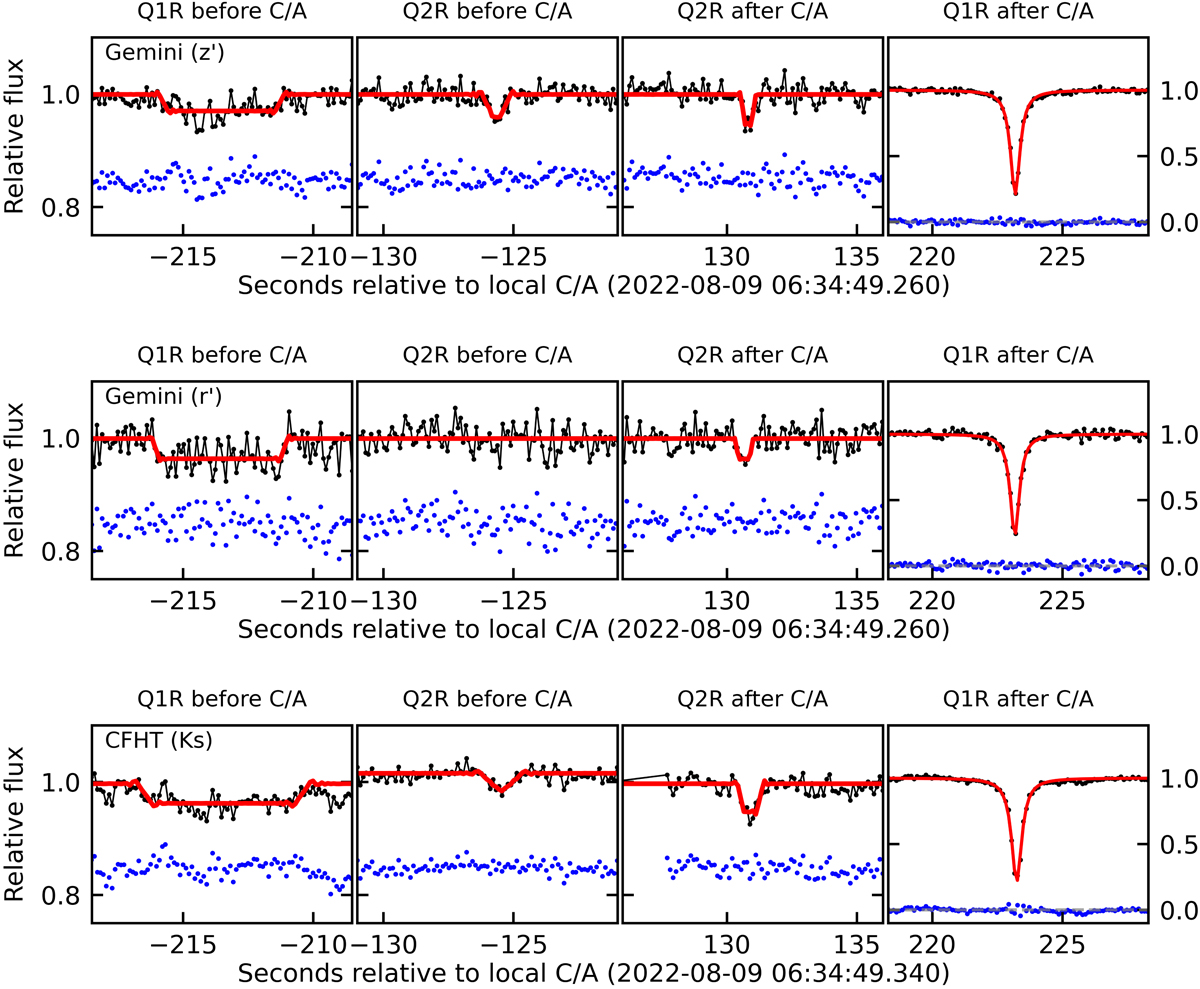
Fig. E.1.
Download original image
Fits to the Q1R and Q2R light curve data taken with Gemini (z’), Gemini (r’), and CFHT (Ks) (the corresponding filters are indicated in parentheses). These light curves are plotted as a function of the time in seconds relative to the local closest approach (C/A). The blue dots represent residuals with an arbitrary vertical offset for clarity. Note: the y-axis scale is different in the rightmost panel in each row (dense part of Q1R).
Current usage metrics show cumulative count of Article Views (full-text article views including HTML views, PDF and ePub downloads, according to the available data) and Abstracts Views on Vision4Press platform.
Data correspond to usage on the plateform after 2015. The current usage metrics is available 48-96 hours after online publication and is updated daily on week days.
Initial download of the metrics may take a while.