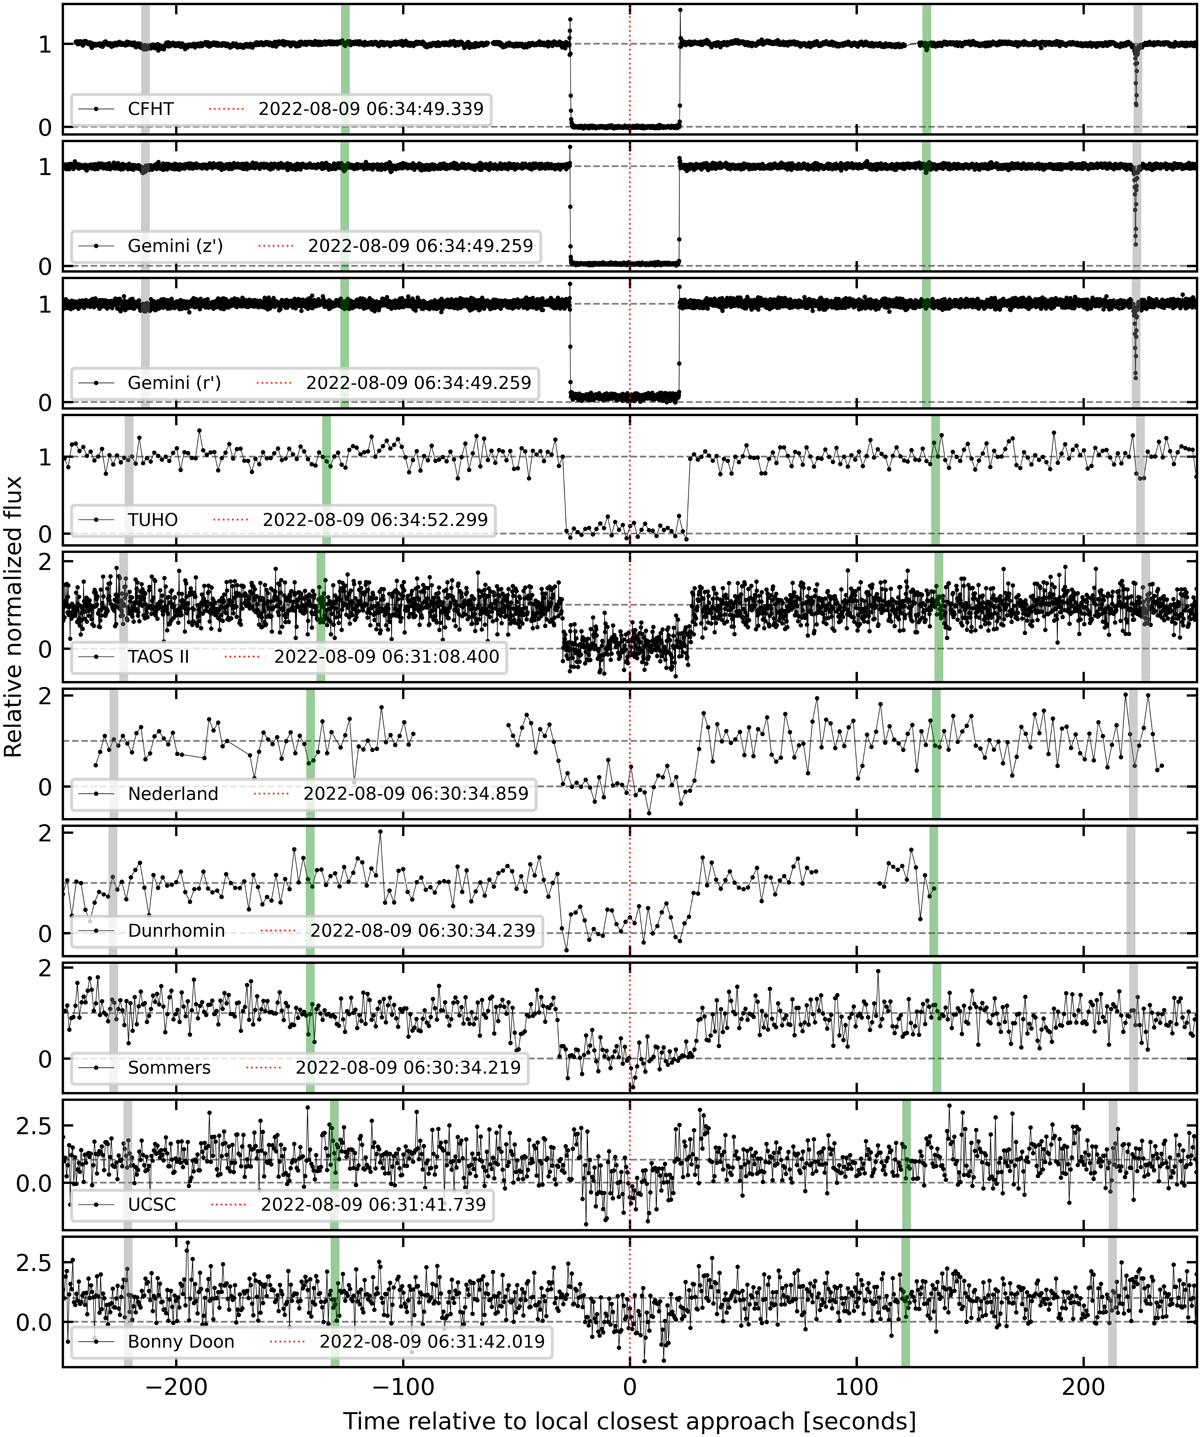
Fig. D.1.
Download original image
All the positive light curves obtained during the August 9, 2022 stellar occultation by Quaoar. The black dots represent the data points. These light curves are plotted as a function of the time in seconds relative to the closest approach for each site. The green and gray vertical lines stand for Q2R and Q1R, respectively. When detected, these lines stand for calculated detection times. For light curves where these secondary structures were not detected, the green and gray lines mark theoretical times expected from our best-fit solution for a circular ring. The horizontal gray dashed lines represent the baseline and minima of the stellar fluxes.
Current usage metrics show cumulative count of Article Views (full-text article views including HTML views, PDF and ePub downloads, according to the available data) and Abstracts Views on Vision4Press platform.
Data correspond to usage on the plateform after 2015. The current usage metrics is available 48-96 hours after online publication and is updated daily on week days.
Initial download of the metrics may take a while.