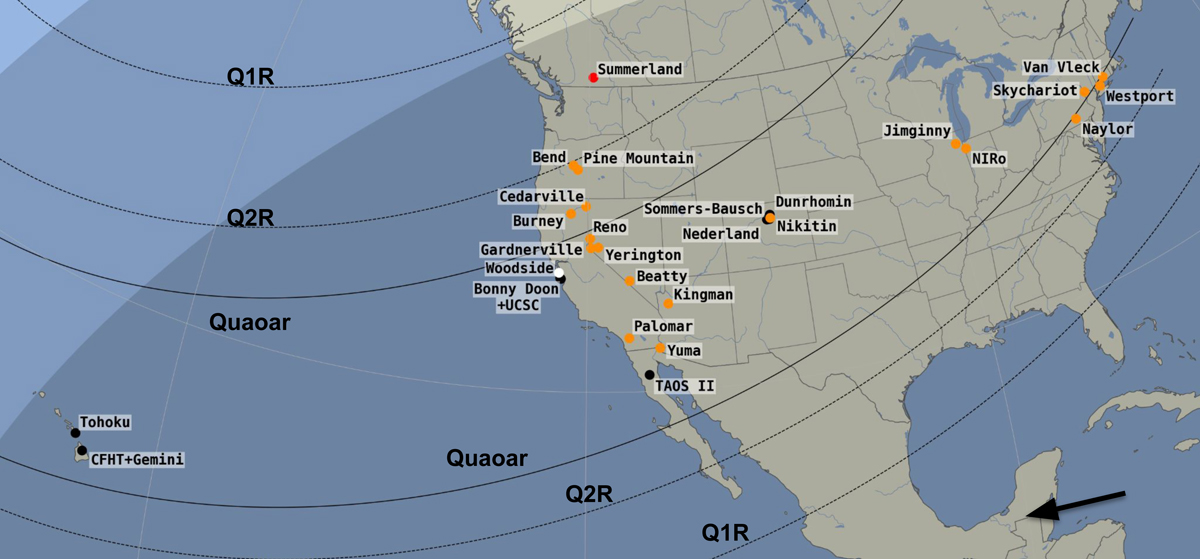
Fig. C.1.
Download original image
Occultation map with positive detections (black dots) and sites that reported cloudy weather (orange dots). The white dot represents no data due to the instrumental limits. In red we display a site with data but no occultation detected. The black solid lines mark Quaoar’s shadow limits and the black dashed lines mark the Q1R and Q2R projections. The black arrow in the bottom right indicates the direction of motion of the shadow.
Current usage metrics show cumulative count of Article Views (full-text article views including HTML views, PDF and ePub downloads, according to the available data) and Abstracts Views on Vision4Press platform.
Data correspond to usage on the plateform after 2015. The current usage metrics is available 48-96 hours after online publication and is updated daily on week days.
Initial download of the metrics may take a while.