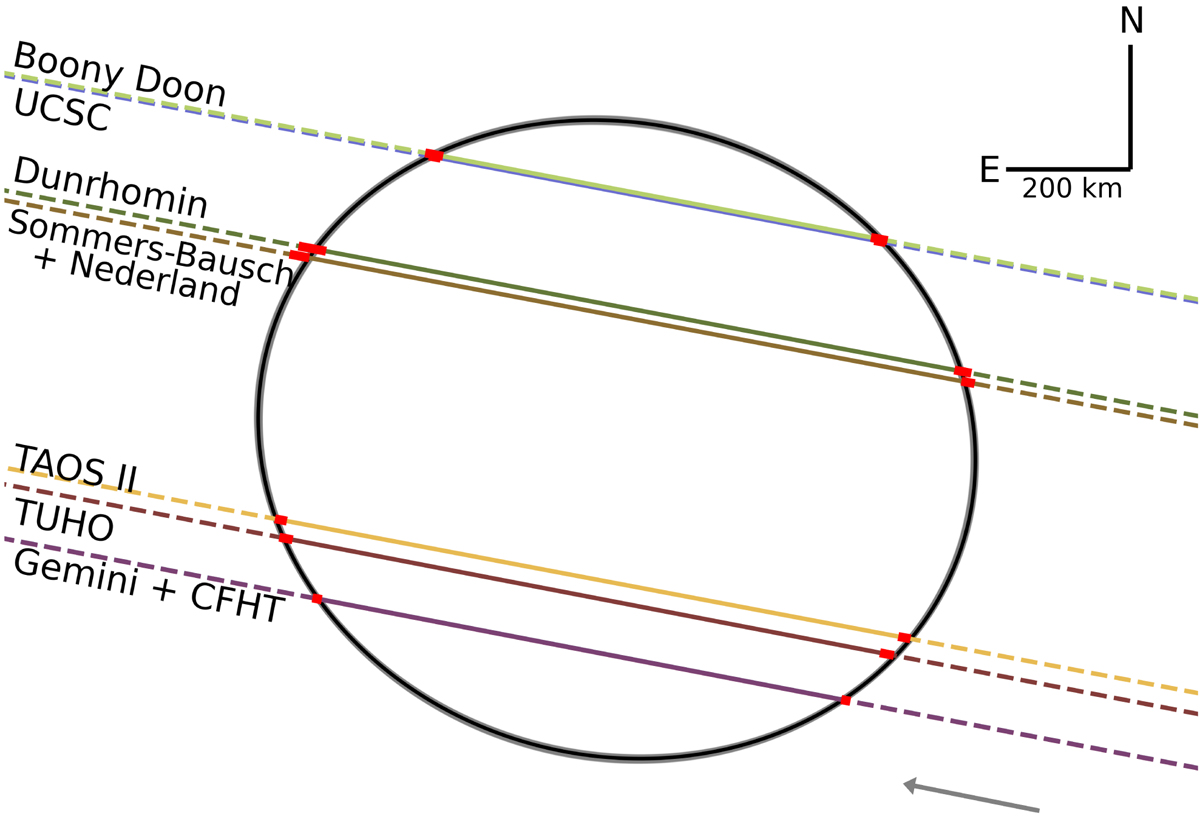
Fig. A.2.
Download original image
Close-up view of Fig. 1 shows the best elliptical fit (black ellipse) and ellipses within 1-σ region (grey) to the ten chords derived from the timings in Table A.1. The grey 1-σ fits differ only slightly from the black best-fit. The red segments represent the 1-σ error bars in the ingress and egress times. At this scale, the Gemini and CFHT chords are superimposed, and their error bars would be too small to be seen (i.e., they are here represented by red squares, much bigger than their actual sizes).
Current usage metrics show cumulative count of Article Views (full-text article views including HTML views, PDF and ePub downloads, according to the available data) and Abstracts Views on Vision4Press platform.
Data correspond to usage on the plateform after 2015. The current usage metrics is available 48-96 hours after online publication and is updated daily on week days.
Initial download of the metrics may take a while.