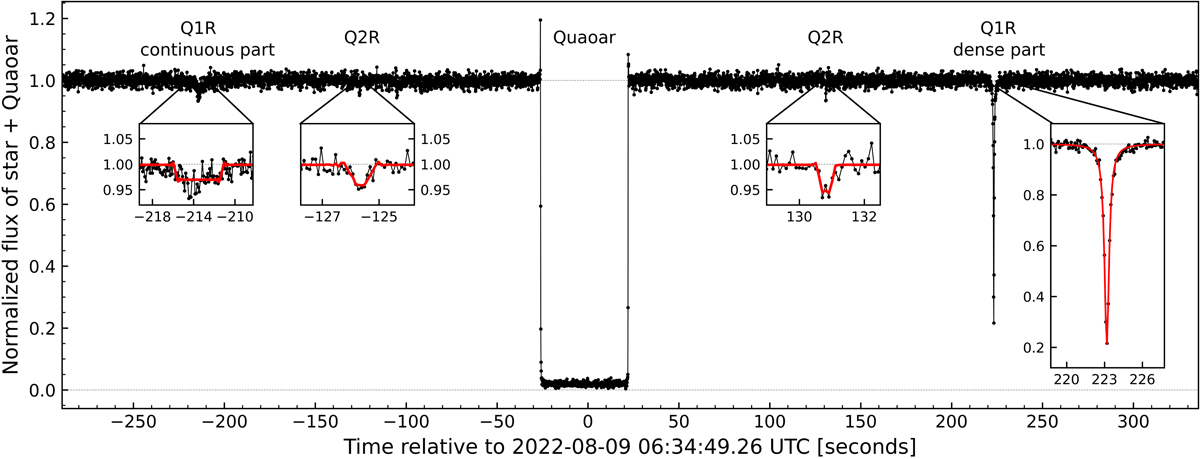
Fig. 2.
Download original image
Detection of Q1R, Q2R, and the main body in the Gemini (z′) light curve. The normalized flux is plotted in black vs. time (UTC), while the best-fitting models are over-plotted in red. The shallow events caused by Q1R (ingress) and Q2R (ingress and egress) are fitted by a square model. A Lorentzian function fits the dense part of Q1R at egress; see Sect. 3. The spikes observed during the disappearance and the re-appearance of the star behind Quaoar stem from the diffraction by the sharp opaque limb of the body. Note: there is a variation in the flux close to −110 and 290 s, caused by sudden variations in the seeing, and they can be neglected. More detailed views of Q1R and Q2R obtained at other telescopes are displayed in Figs. 3, D.1, E.1, and E.2.
Current usage metrics show cumulative count of Article Views (full-text article views including HTML views, PDF and ePub downloads, according to the available data) and Abstracts Views on Vision4Press platform.
Data correspond to usage on the plateform after 2015. The current usage metrics is available 48-96 hours after online publication and is updated daily on week days.
Initial download of the metrics may take a while.