Fig. 2.

Download original image
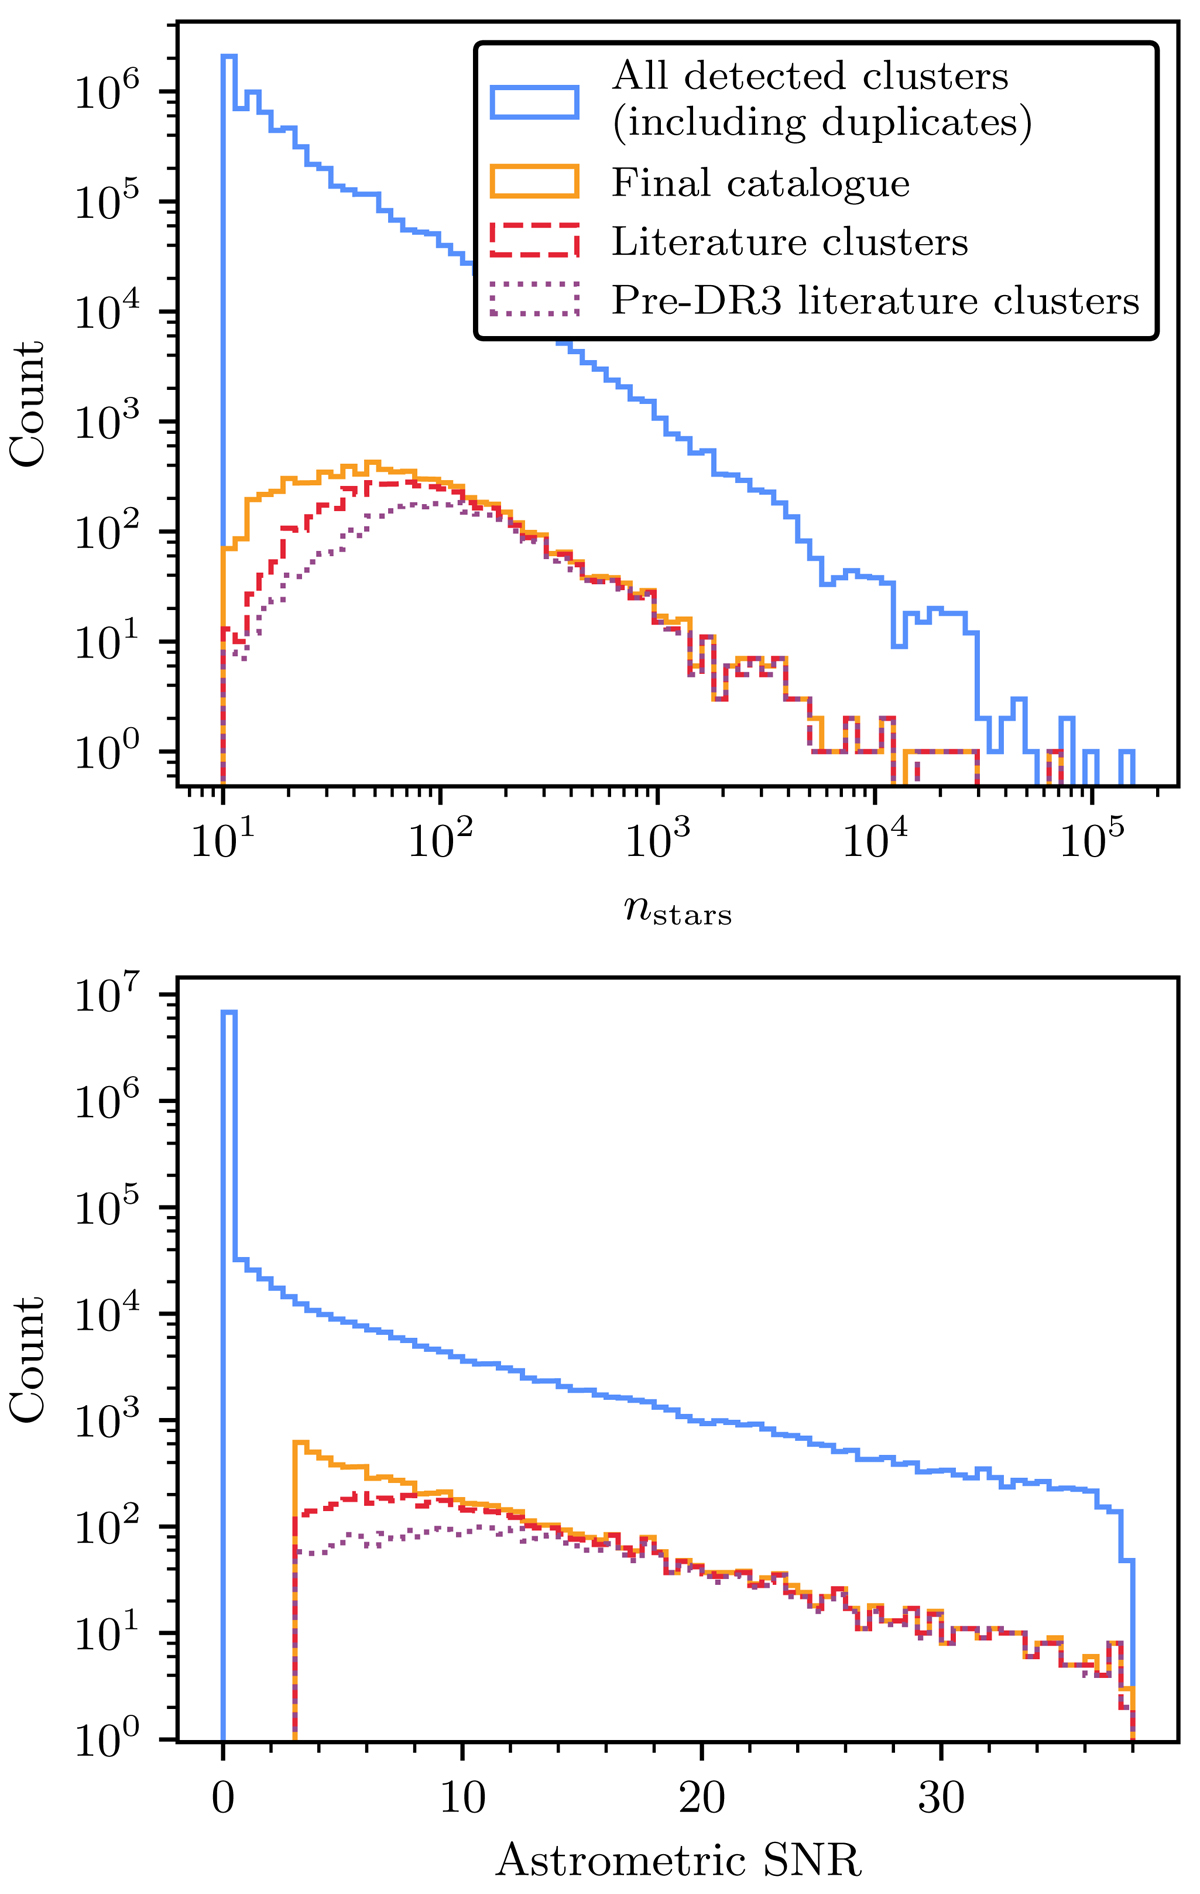
Statistics of all detected clusters compared against the final catalogue. Top: distribution of the number of member stars of detected clusters, nstars, for all detected clusters in all fields before catalogue merging and duplicate removal (solid blue line), for the final catalogue (solid orange line), and amongst clusters in the final catalogue that crossmatch to clusters in the literature, for all literature clusters (solid red line) and for only those detected before the release of Gaia EDR3 (dotted purple line). Bottom: as above, but for the astrometric S/N (CST score) for all clusters in these sets. S/Ns have a maximum value of 38 due to numerical reasons.
Current usage metrics show cumulative count of Article Views (full-text article views including HTML views, PDF and ePub downloads, according to the available data) and Abstracts Views on Vision4Press platform.
Data correspond to usage on the plateform after 2015. The current usage metrics is available 48-96 hours after online publication and is updated daily on week days.
Initial download of the metrics may take a while.


