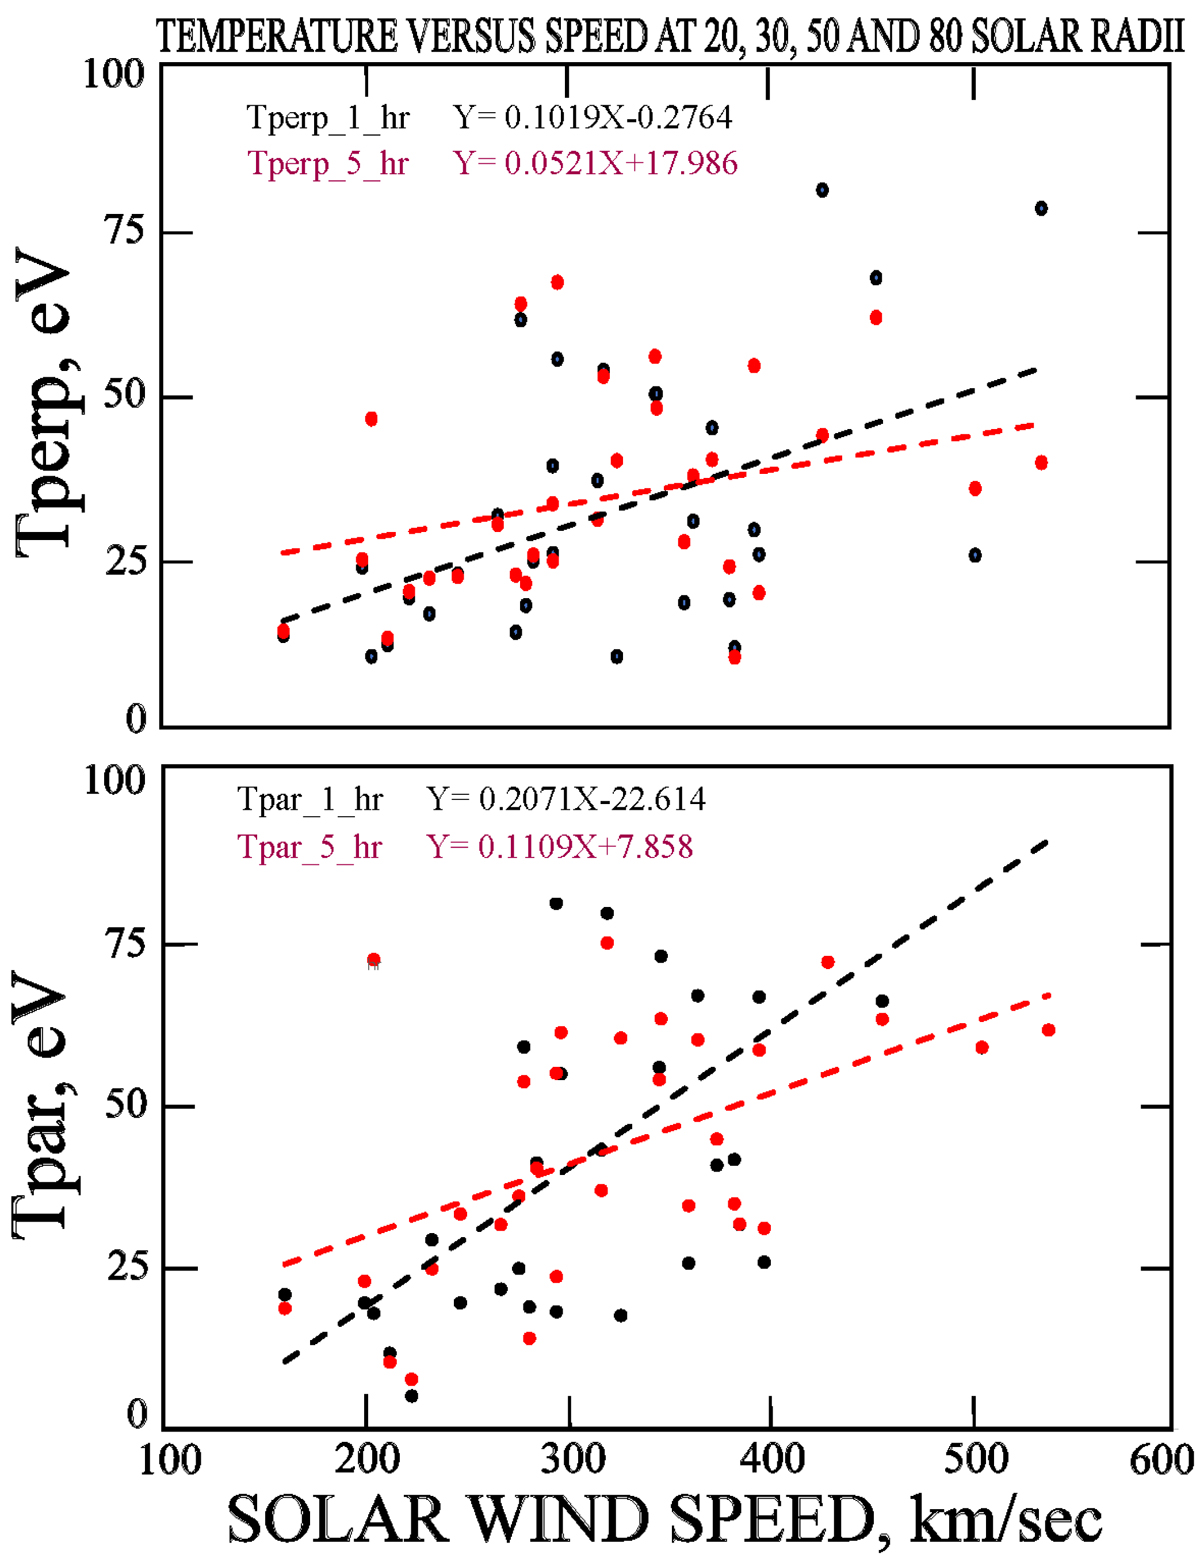
Fig. 2.
Download original image
Perpendicular (upper panel) and parallel (lower panel) one-hour-averaged (black dots) and five-hour-averaged (red dots) measurements of the temperatures vs. solar wind speed at 20, 30, 50, and 80 solar radii on Parker Solar Probe orbits 6, 7, 8, and 9. Linear least-squares fits to these data are illustrated as the black and red dashed curves whose equations are also given in the figure.
Current usage metrics show cumulative count of Article Views (full-text article views including HTML views, PDF and ePub downloads, according to the available data) and Abstracts Views on Vision4Press platform.
Data correspond to usage on the plateform after 2015. The current usage metrics is available 48-96 hours after online publication and is updated daily on week days.
Initial download of the metrics may take a while.