Fig. 7.
Download original image
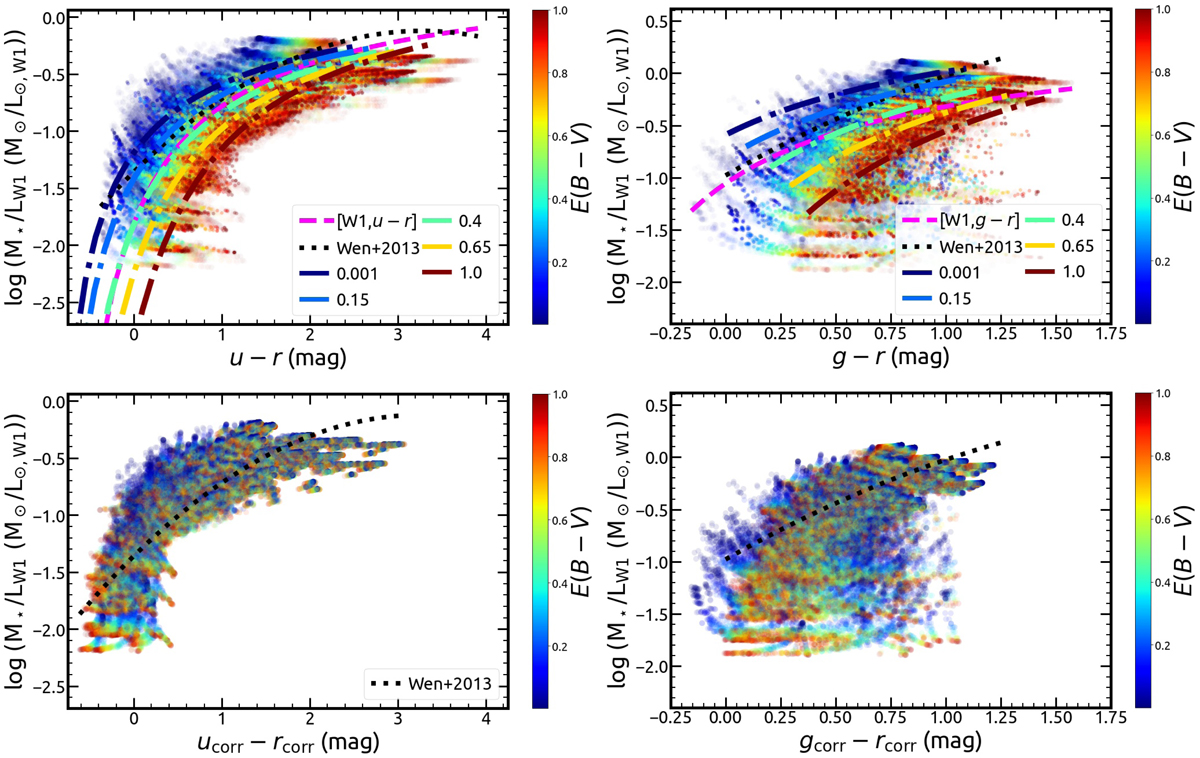
Mass-to-light ratio as a function of u − r (left column) and g − r (right column) color for the SDSS-matched sample of the modeled galaxies. In the bottom row, the u − r and g − r colors are corrected for extinction while in the top row, they are not. The galaxies are color-coded based on their E(B − V). The dashed magenta line represents the extinction-independent relation of Eq. (6), and the dashed-dotted lines the extinction-dependent, drawn for some discrete E(B − V) values as shown in the legend using the parameters presented in Table 3. The dotted black line shows the relations of Wen et al. (2013).
Current usage metrics show cumulative count of Article Views (full-text article views including HTML views, PDF and ePub downloads, according to the available data) and Abstracts Views on Vision4Press platform.
Data correspond to usage on the plateform after 2015. The current usage metrics is available 48-96 hours after online publication and is updated daily on week days.
Initial download of the metrics may take a while.