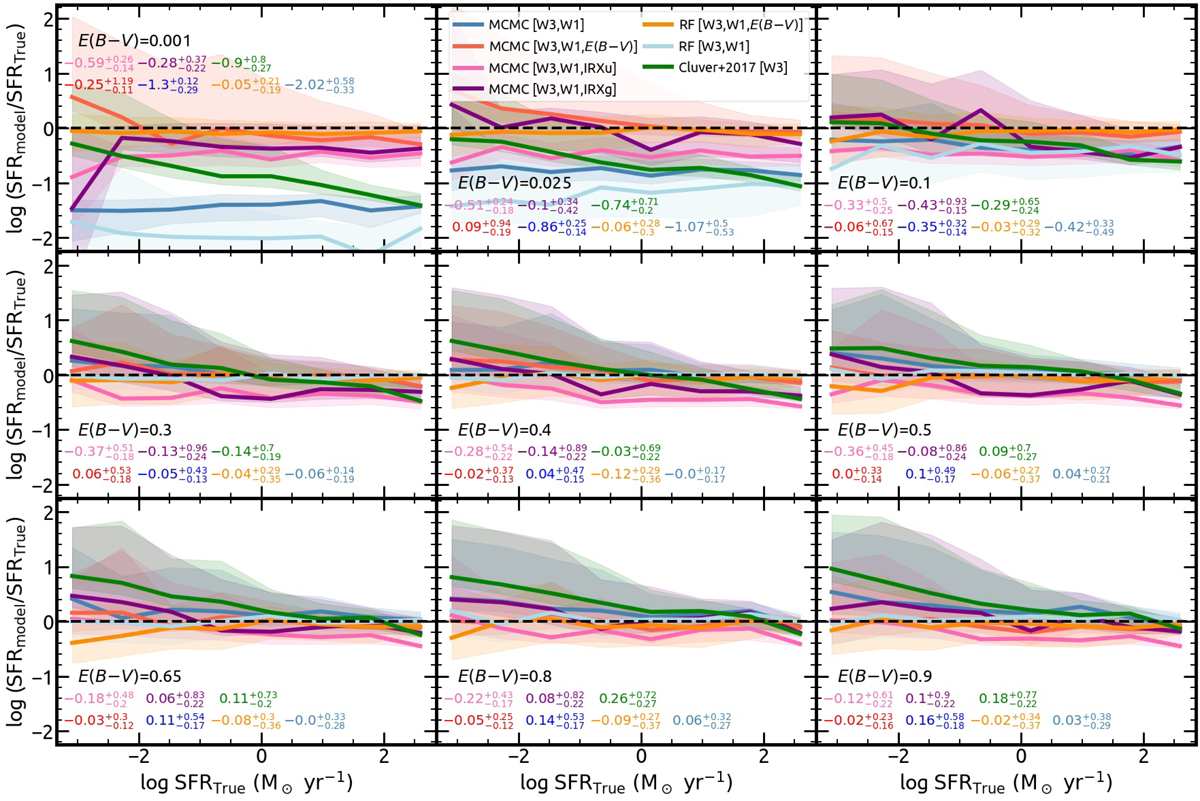
Fig. 5.
Download original image
Comparison between the true SFR as given by the CIGALE output, and the best-fit models of Eq. (4) (MCMC; Table 1), and the random forest machine learning method (RF) using the WISE bands 1 and 3. The y-axis represents the logarithm of the ratio between the SFR of each model and the true SFR, thus the black dashed line at zero represents equality. Blue, red, pink, and purple colors show the extinction-independent, and extinction-dependent (E(B − V), IRXu, IRXg) relations of Eq. (4) respectively. With light-blue and orange colors are the extinction-independent, and extinction-dependent models based on the RF method respectively. The linear log LW3–log SFR calibration by Cluver et al. (2017) is also displayed in green color. The lines represent the distribution modes and the shaded areas show the 68% percentiles of the log (SFRmodel/SFRtrue) as a function of the log SFRtrue. Each panel shows the comparison of galaxy models with one of the discrete E(B − V) values, shown in the bottom left corner of each panel. This comparison is performed with a uniform-E(B − V) sample, therefore, there is an equal number of sources for each extinction value. At the bottom of each panel are the modes and 68% percentiles of the log (SFRmodel/SFRTrue) distribution for all galaxy models with the specific E(B − V), shown with corresponding colors to the relations used to derive the SFR. These comparisons are also summarized in Table 2.
Current usage metrics show cumulative count of Article Views (full-text article views including HTML views, PDF and ePub downloads, according to the available data) and Abstracts Views on Vision4Press platform.
Data correspond to usage on the plateform after 2015. The current usage metrics is available 48-96 hours after online publication and is updated daily on week days.
Initial download of the metrics may take a while.