Fig. 4.
Download original image
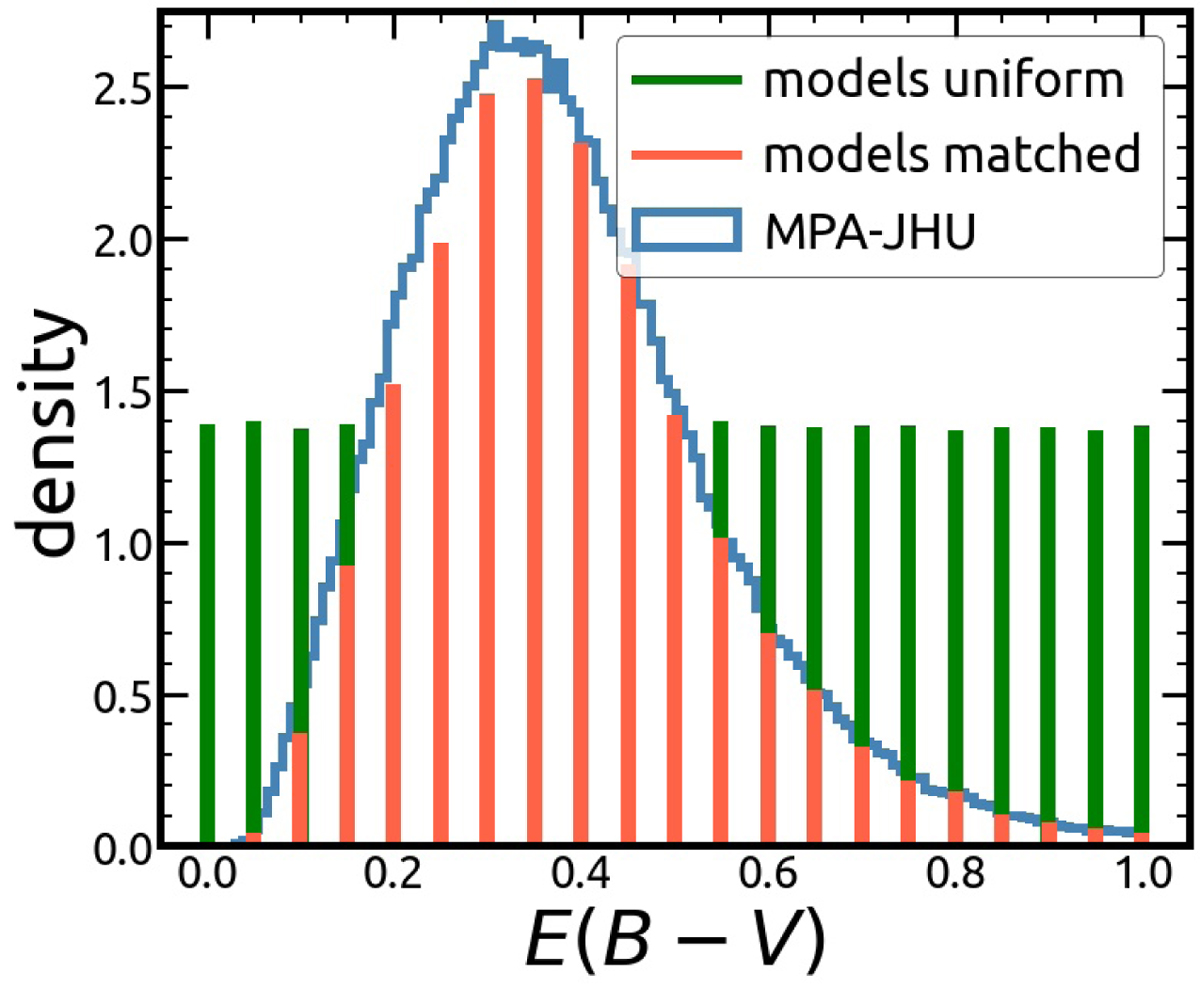
Distribution of E(B − V) for the uniform (green histogram) and the SDSS-matched samples (red histogram) of model galaxies. With blue color is the nebular E(B − V) distribution based on the Balmer decrement for sources in the SDSS spectroscopic MPA-JHU catalog considering only star-forming galaxies with E(B − V)/E(B − V)err > 3. The ordinate corresponds to density which is equal to the ratio of the count of each bin to the total number of counts multiplied by the bin width with the integral of the area under the histogram being equal to one.
Current usage metrics show cumulative count of Article Views (full-text article views including HTML views, PDF and ePub downloads, according to the available data) and Abstracts Views on Vision4Press platform.
Data correspond to usage on the plateform after 2015. The current usage metrics is available 48-96 hours after online publication and is updated daily on week days.
Initial download of the metrics may take a while.