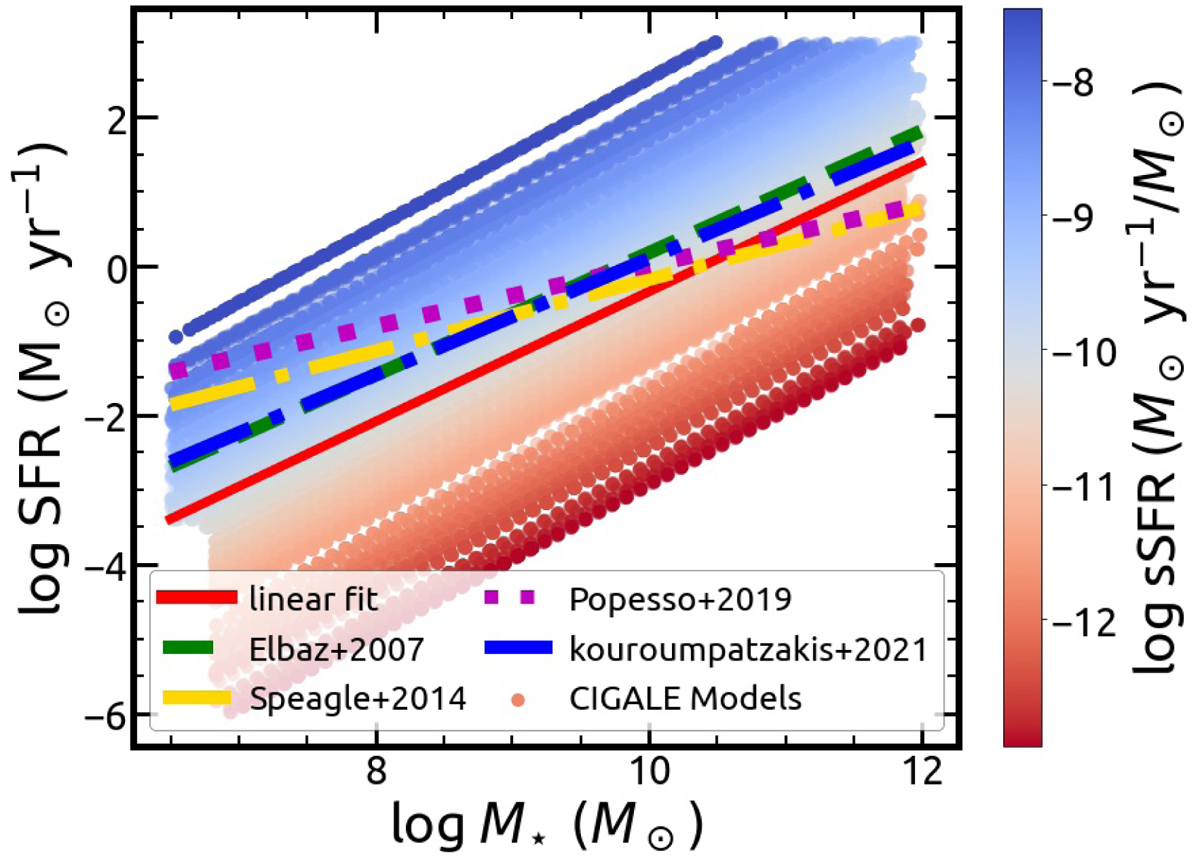
Fig. 3.
Download original image
SFR, M⋆ plane for the final sample of CIGALE model galaxies used for the rest of the analysis and fitting. The color code indicates their specific SFR [sSFR ≡ SFR/M⋆ (M⊙ yr−1/M⊙)]. The best linear fit is represented with a red line. The green dashed, yellow dashed-dotted, magenta dotted, and blue dashed-dotted lines represent the main sequence for diverse samples of local Universe galaxies from Elbaz et al. (2007), Speagle et al. (2014), Popesso et al. (2019), and Kouroumpatzakis et al. (2021) respectively.
Current usage metrics show cumulative count of Article Views (full-text article views including HTML views, PDF and ePub downloads, according to the available data) and Abstracts Views on Vision4Press platform.
Data correspond to usage on the plateform after 2015. The current usage metrics is available 48-96 hours after online publication and is updated daily on week days.
Initial download of the metrics may take a while.