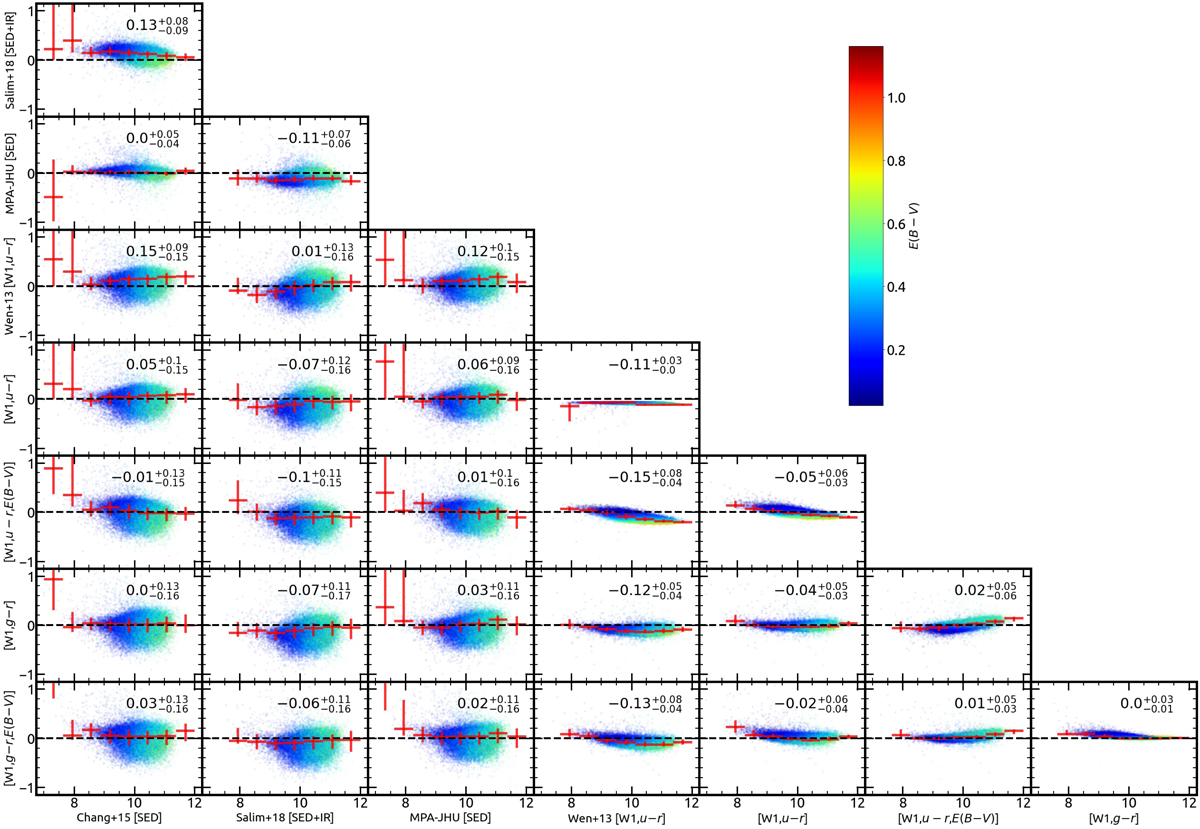
Fig. 10.
Download original image
Comparisons between stellar masses estimated through (a) the extinction-dependent, and extinction-independent relations of Eq. (6) based on the MCMC fitting (Table 3) which utilize the WISE band-1 photometry and the u − r or the g − r color, (b) the calibration of Wen et al. (2013) which uses the WISE band 1 and the u − r color and (c) based on SED fitting from Chang et al. (2015), Salim et al. (2018), and MPA-JHU (Kauffmann et al. 2003; Brinchmann et al. 2004; Tremonti et al. 2004). In each subplot, the ordinate indicates the logarithm of the ratio (log (M⋆, y/M⋆, x)) between the compared M⋆ estimations, and the abscissa the logarithm of the M⋆ as indicated in the axes labels. Red error bars represent the modes and 68% percentiles of the distribution of galaxies within bins of log M⋆/M⊙ ≃ 0.6 (8 bins within the range 7 < log M⋆/M⊙ < 12). The log M⋆y/M⋆x modes and 68% percentiles for all the galaxies compared in each panel are shown at the top right of each subplot. The points are color-coded based on the galaxies’ nebular E(B − V). The black dashed line represents equality.
Current usage metrics show cumulative count of Article Views (full-text article views including HTML views, PDF and ePub downloads, according to the available data) and Abstracts Views on Vision4Press platform.
Data correspond to usage on the plateform after 2015. The current usage metrics is available 48-96 hours after online publication and is updated daily on week days.
Initial download of the metrics may take a while.