Fig. 6.
Download original image
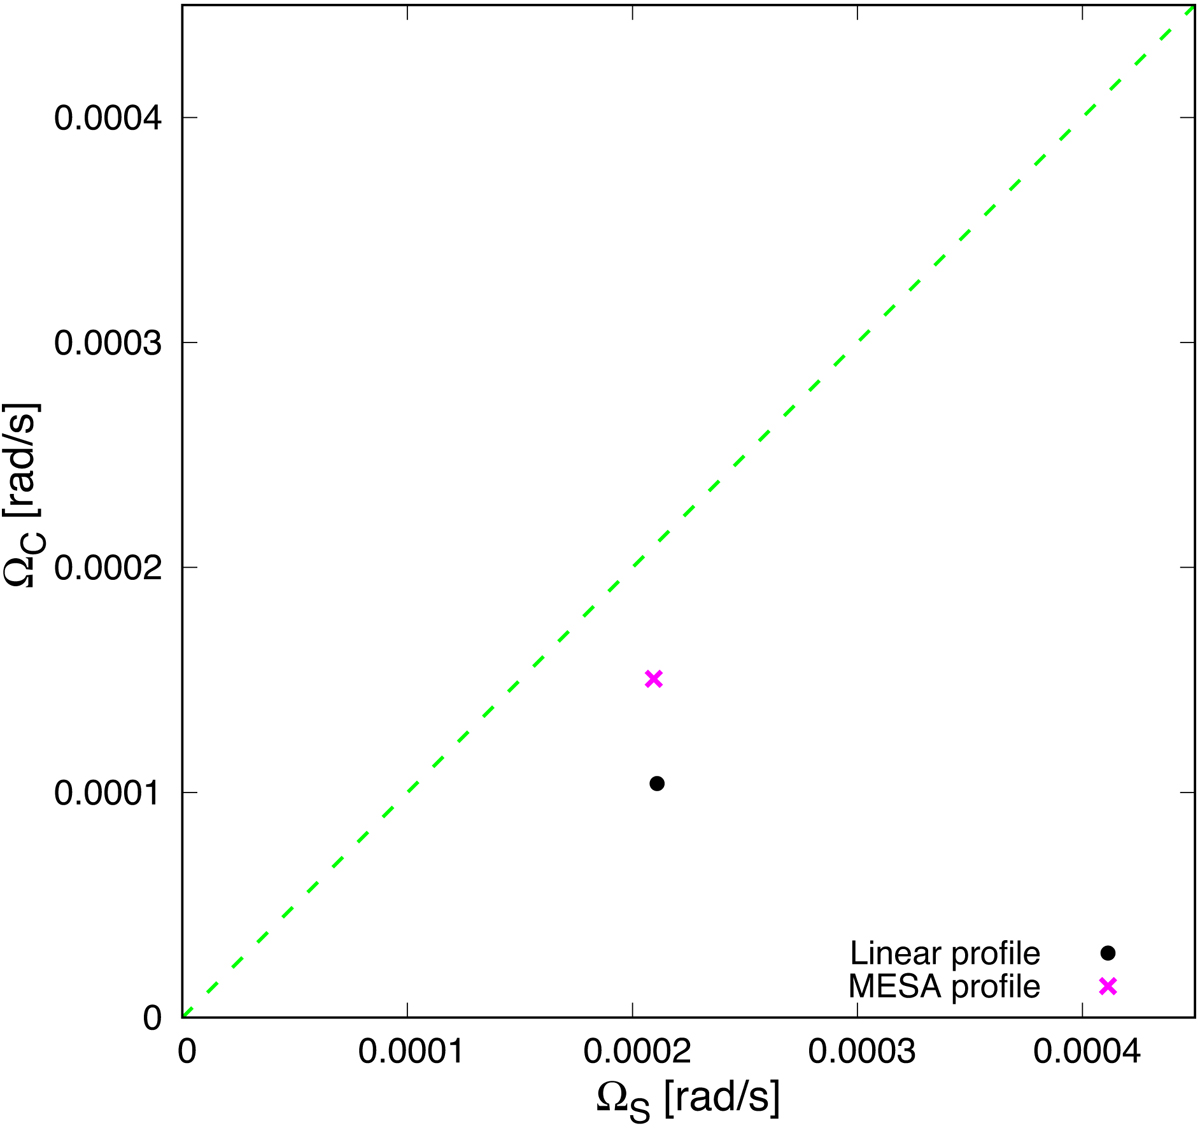
Comparison between the values of ΩS and ΩC obtained from the best-fit solution to the linear differential rotation profiles (black dot) when considering all the splittings with ℓ = 1, 2 and the corresponding values when the rotation profile is that of the MESA evolutionary model (magenta cross). The dashed green line indicates the solutions according to rigid rotation.
Current usage metrics show cumulative count of Article Views (full-text article views including HTML views, PDF and ePub downloads, according to the available data) and Abstracts Views on Vision4Press platform.
Data correspond to usage on the plateform after 2015. The current usage metrics is available 48-96 hours after online publication and is updated daily on week days.
Initial download of the metrics may take a while.