Open Access
Fig. 5.
Download original image
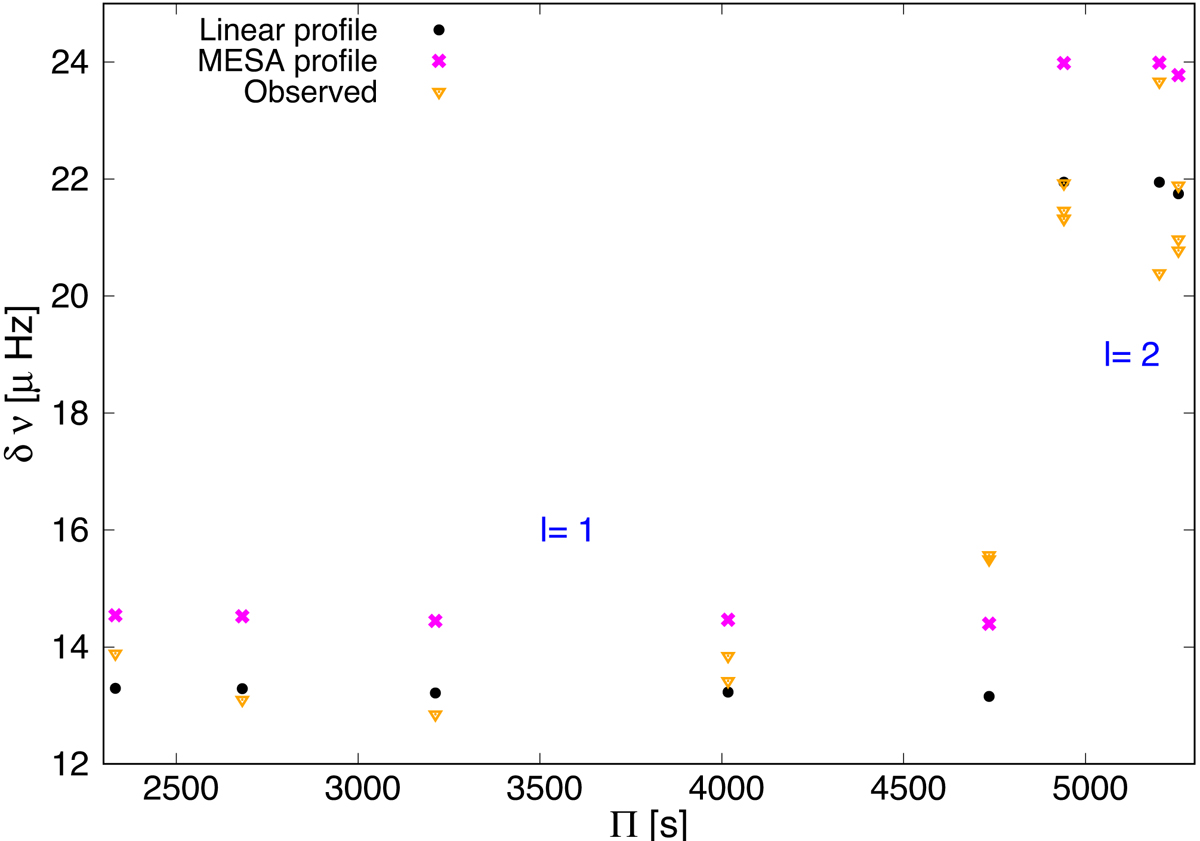
Observed frequency splittings (orange triangles), theoretical frequency splittings obtained from the best-fitting linear differential rotation profile (black dots), and theoretical frequency splittings resulting from the rotation profile of the MESA model (magenta crosses), in terms of the corresponding theoretical periods.
Current usage metrics show cumulative count of Article Views (full-text article views including HTML views, PDF and ePub downloads, according to the available data) and Abstracts Views on Vision4Press platform.
Data correspond to usage on the plateform after 2015. The current usage metrics is available 48-96 hours after online publication and is updated daily on week days.
Initial download of the metrics may take a while.