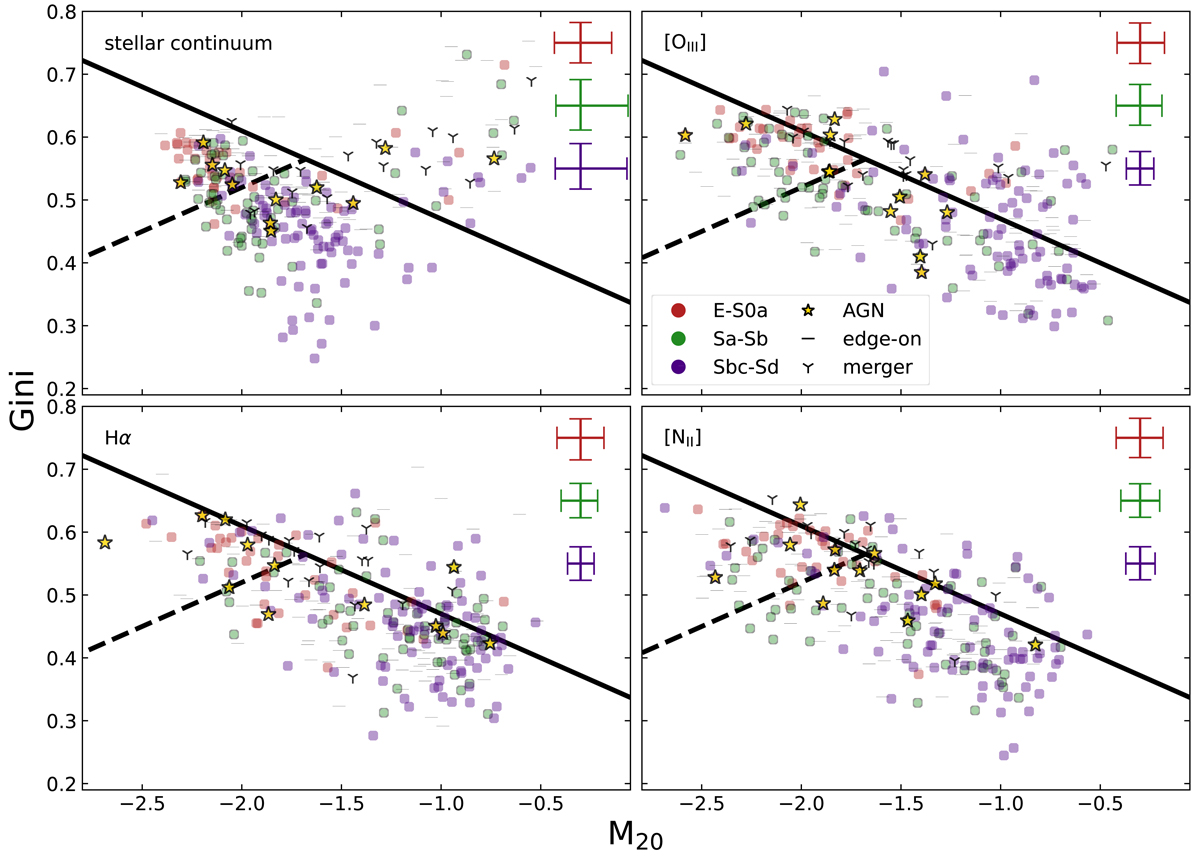
Fig. 5.
Download original image
M20–Gini relation for the CALIFA galaxies. Each panel shows the scatter plot of the M20–Gini relation for the stellar continuum and three different spectral features. The solid and dashed black lines are defined in Lotz et al. (2008a). The solid black line roughly separates galaxies between isolated and mergers, whereas the dashed black line divides galaxies into early and late types. Each point represents a galaxy, colour-coded according to their morphological group. AGNs are marked with a golden star. All galaxies with an inclination greater than 80° are marked with a horizontal bar, while all mergers are indicated with a triangle. The average uncertainties of each galaxy group are shown in the top-right corner of each panel.
Current usage metrics show cumulative count of Article Views (full-text article views including HTML views, PDF and ePub downloads, according to the available data) and Abstracts Views on Vision4Press platform.
Data correspond to usage on the plateform after 2015. The current usage metrics is available 48-96 hours after online publication and is updated daily on week days.
Initial download of the metrics may take a while.