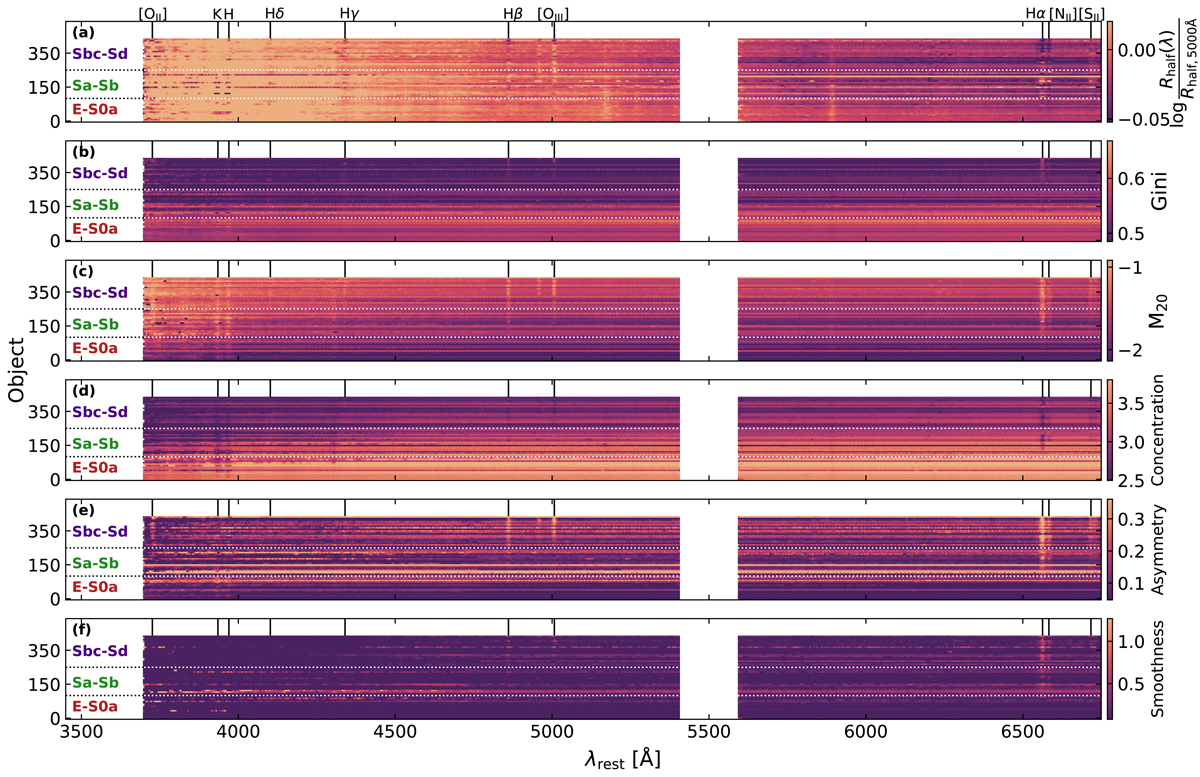
Fig. 3.

Download original image
Non-parametric morphological properties as a function of rest-frame wavelength. In this plot we show the results of Statmorph applied on the IFU data of 364 CALIFA galaxies. From top to bottom we present the wavelength dependence of log Rhalf(λ)/Rhalf, 5000 Å, Gini, M20, C, A, and S. The galaxy spectra are stacked according to their morphological type, and they are sorted with increasing SFR per galaxy population. The horizontal dotted lines show the borders between the three galaxy populations. The vertical solid lines indicate the central wavelength of the most prominent spectral features. The white rectangle centred around 5500 Å masks the area of the telluric features in the spectrum. The spectra were binned in wavelength to smooth out the noise.
Current usage metrics show cumulative count of Article Views (full-text article views including HTML views, PDF and ePub downloads, according to the available data) and Abstracts Views on Vision4Press platform.
Data correspond to usage on the plateform after 2015. The current usage metrics is available 48-96 hours after online publication and is updated daily on week days.
Initial download of the metrics may take a while.


