Fig. 2.
Download original image
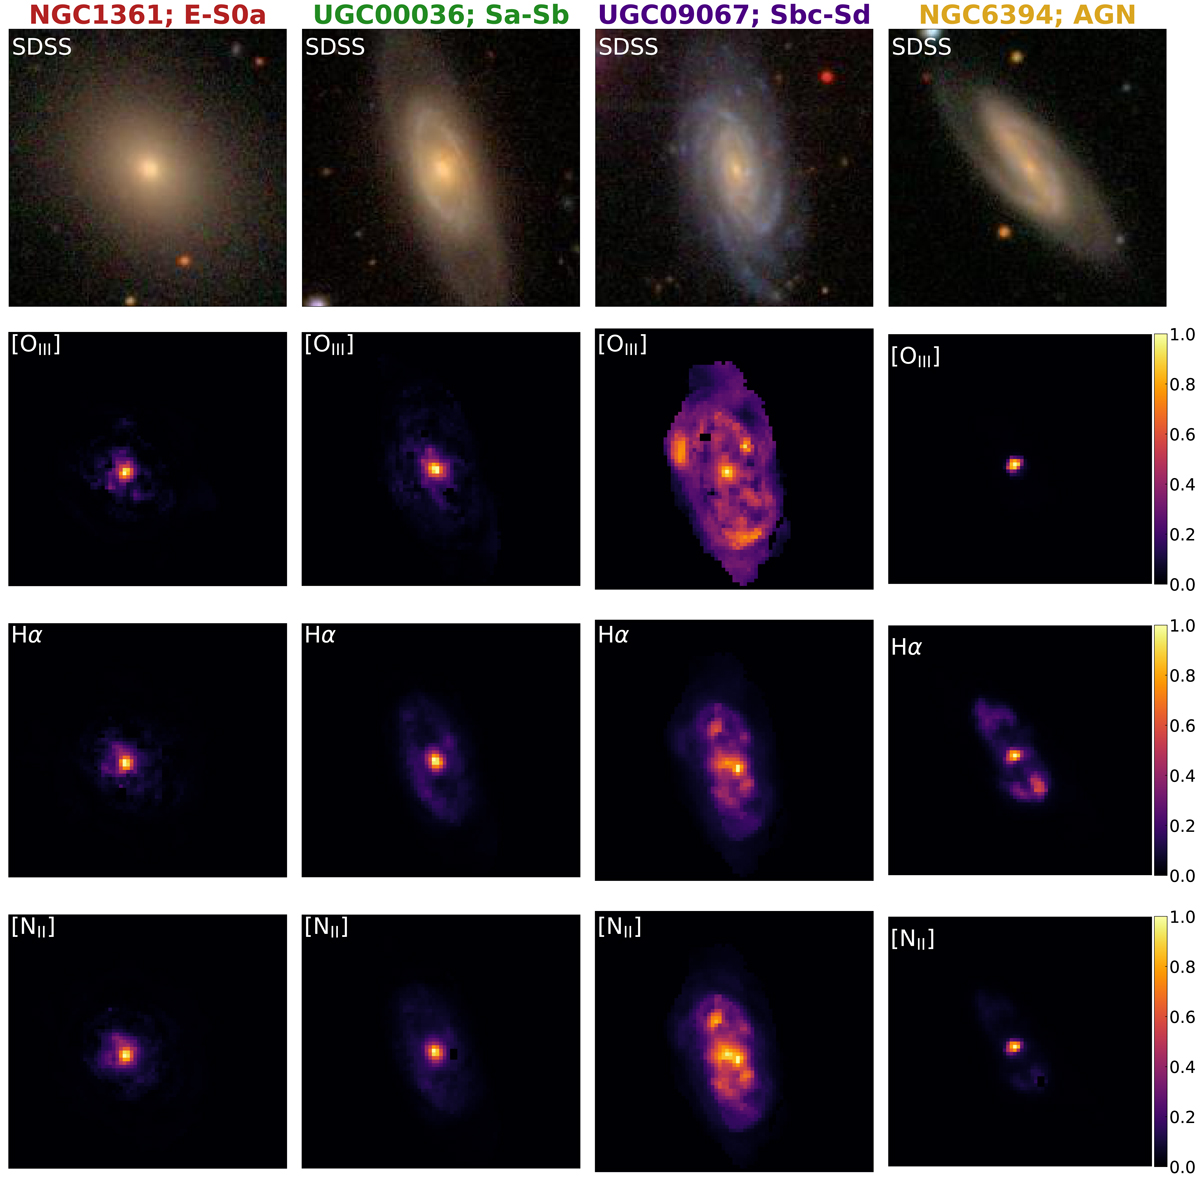
Individual emission-line maps of four galaxies in our sample. Each galaxy was randomly selected from its corresponding morphological group. We also show an AGN host galaxy (fourth column). For each galaxy, we show an optical image from SDSS (top row), and the continuum-subtracted emission-line maps of [O III]λ5007, Hα, and [N II]λ6583. The emission-line maps are in units of normalised flux density.
Current usage metrics show cumulative count of Article Views (full-text article views including HTML views, PDF and ePub downloads, according to the available data) and Abstracts Views on Vision4Press platform.
Data correspond to usage on the plateform after 2015. The current usage metrics is available 48-96 hours after online publication and is updated daily on week days.
Initial download of the metrics may take a while.