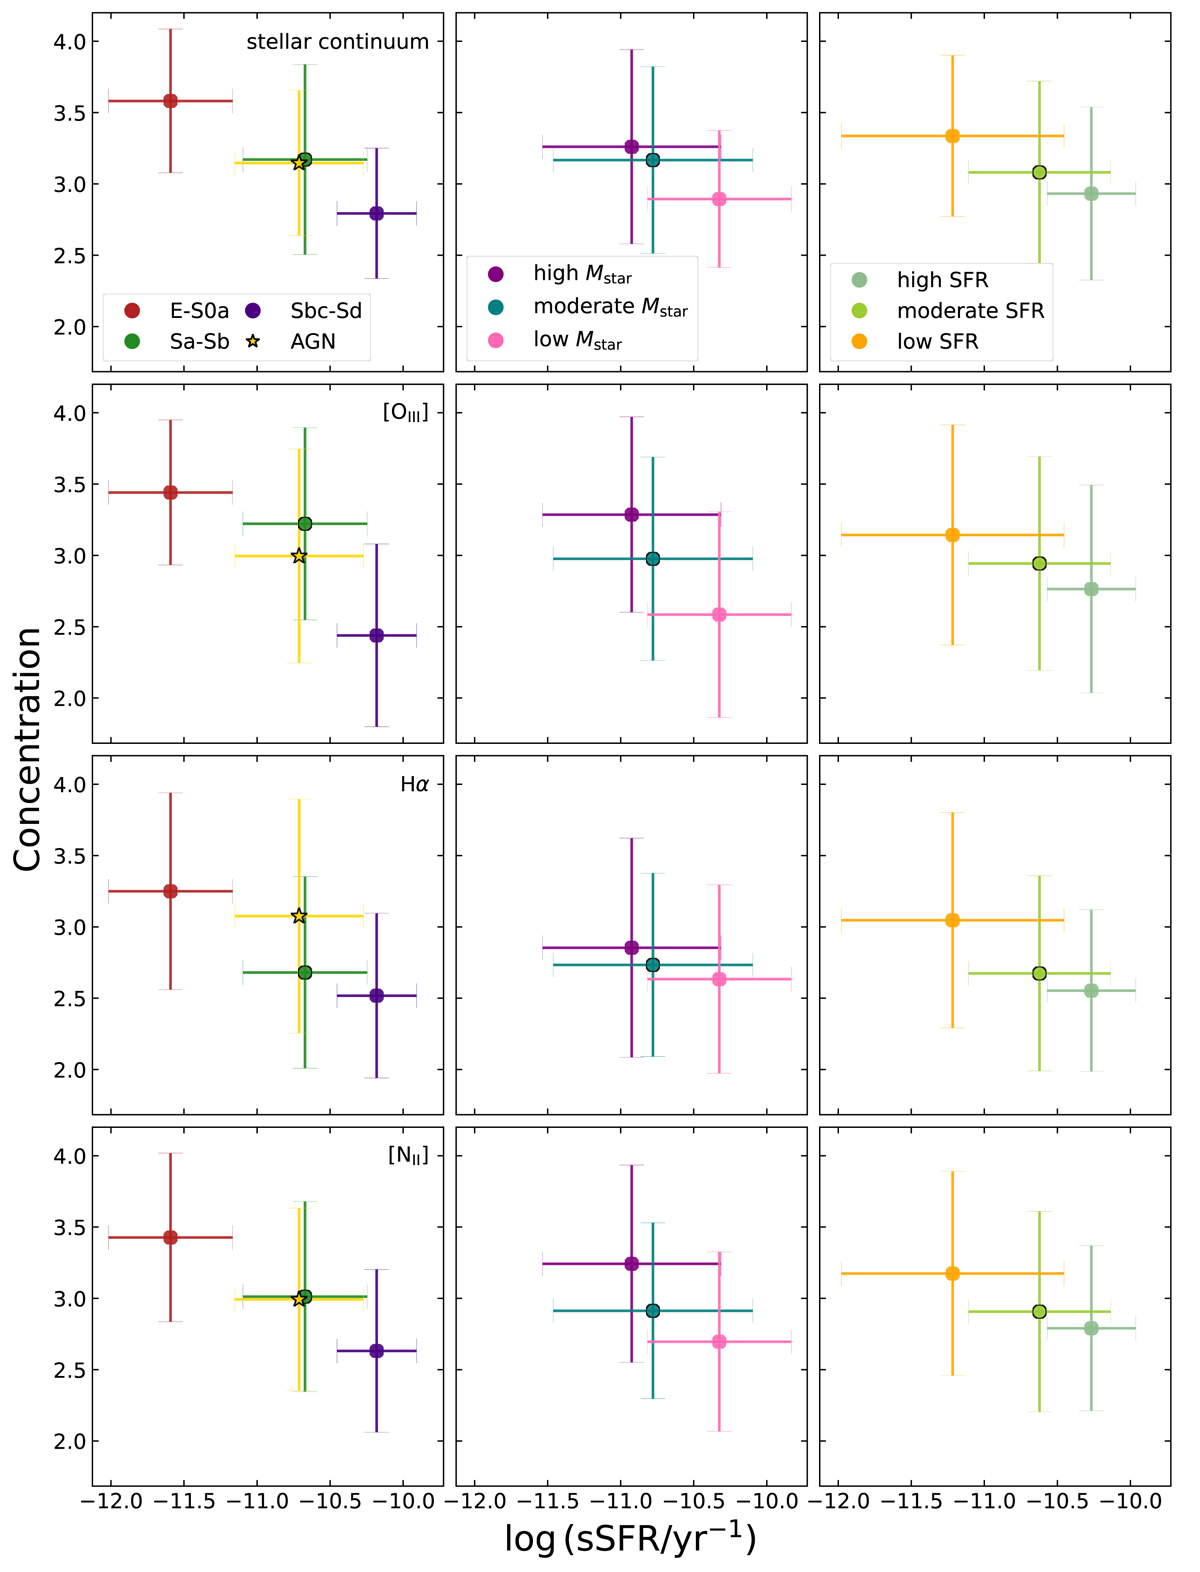
Fig. 11.
Download original image
Average trends of the concentration index as a function of sSFR. Each row shows the scatter plot of the sSFR–C relation for the stellar continuum emission and three different spectral lines. Left column: the data are binned according to the morphological group they are belong to, similarly to Fig. 10. Middle column: galaxies are binned according to their stellar mass into low Mstar (log Mstar < 10.4), moderate Mstar (10.4 ≤ log Mstar < 10.82), and high Mstar (log Mstar ≥ 10.82). Right column: galaxies are binned according to their star-formation activity into low SFR (log SFR < −0.52), moderate SFR (−0.52 ≤ log SFR < 0.14), and high SFR (log SFR ≥ 0.14). All bins were defined in such a way so that they contain roughly one third of the objects in our sample. The error bars are the standard deviation of the mean values.
Current usage metrics show cumulative count of Article Views (full-text article views including HTML views, PDF and ePub downloads, according to the available data) and Abstracts Views on Vision4Press platform.
Data correspond to usage on the plateform after 2015. The current usage metrics is available 48-96 hours after online publication and is updated daily on week days.
Initial download of the metrics may take a while.