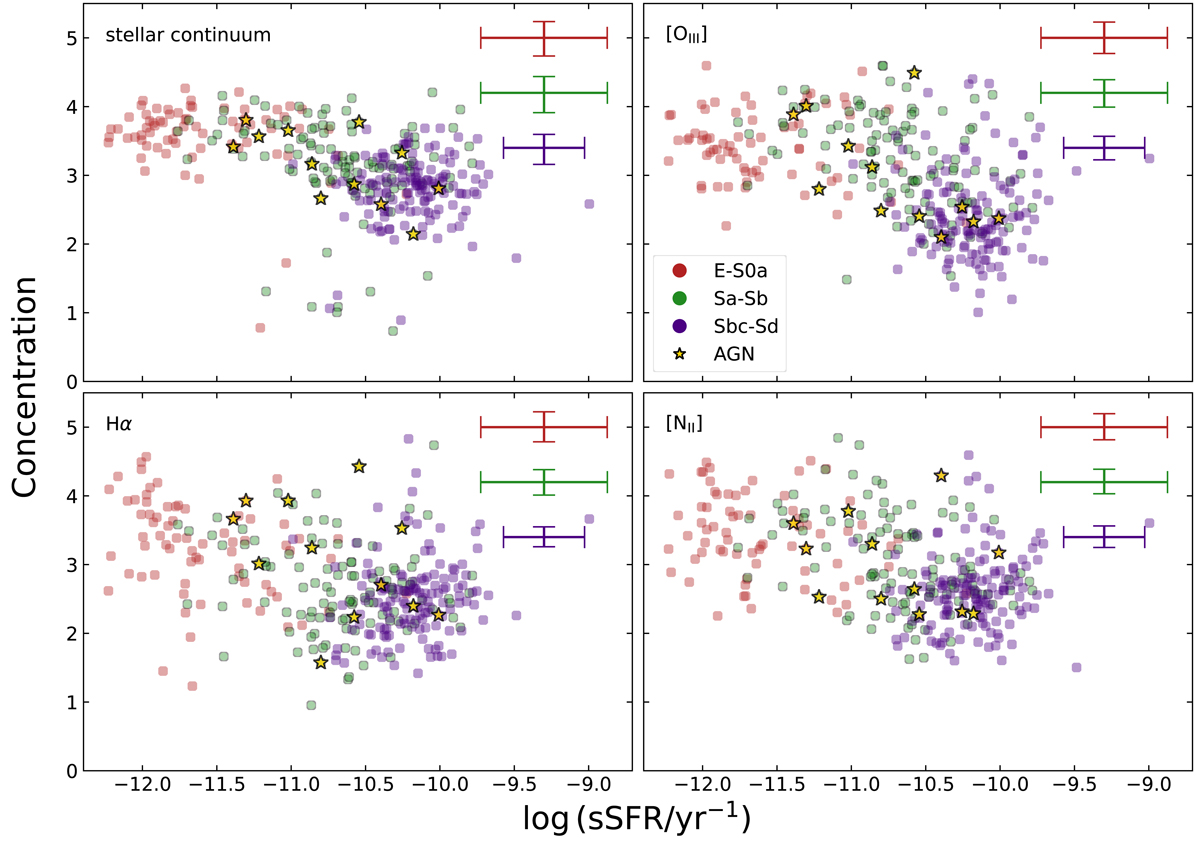
Fig. 10.
Download original image
Concentration as a function of sSFR. Each panel shows the scatter plot of the sSFR–C relation for the stellar continuum emission and three spectral lines. Each point represents a galaxy, colour-coded according to the morphological group they are belong to. AGNs are marked with a golden star. The average uncertainties of C for the different galaxy groups are shown in the top-right corner of each panel. We calculate the standard deviation of sSFR for each galaxy population.
Current usage metrics show cumulative count of Article Views (full-text article views including HTML views, PDF and ePub downloads, according to the available data) and Abstracts Views on Vision4Press platform.
Data correspond to usage on the plateform after 2015. The current usage metrics is available 48-96 hours after online publication and is updated daily on week days.
Initial download of the metrics may take a while.