Fig. 1.
Download original image
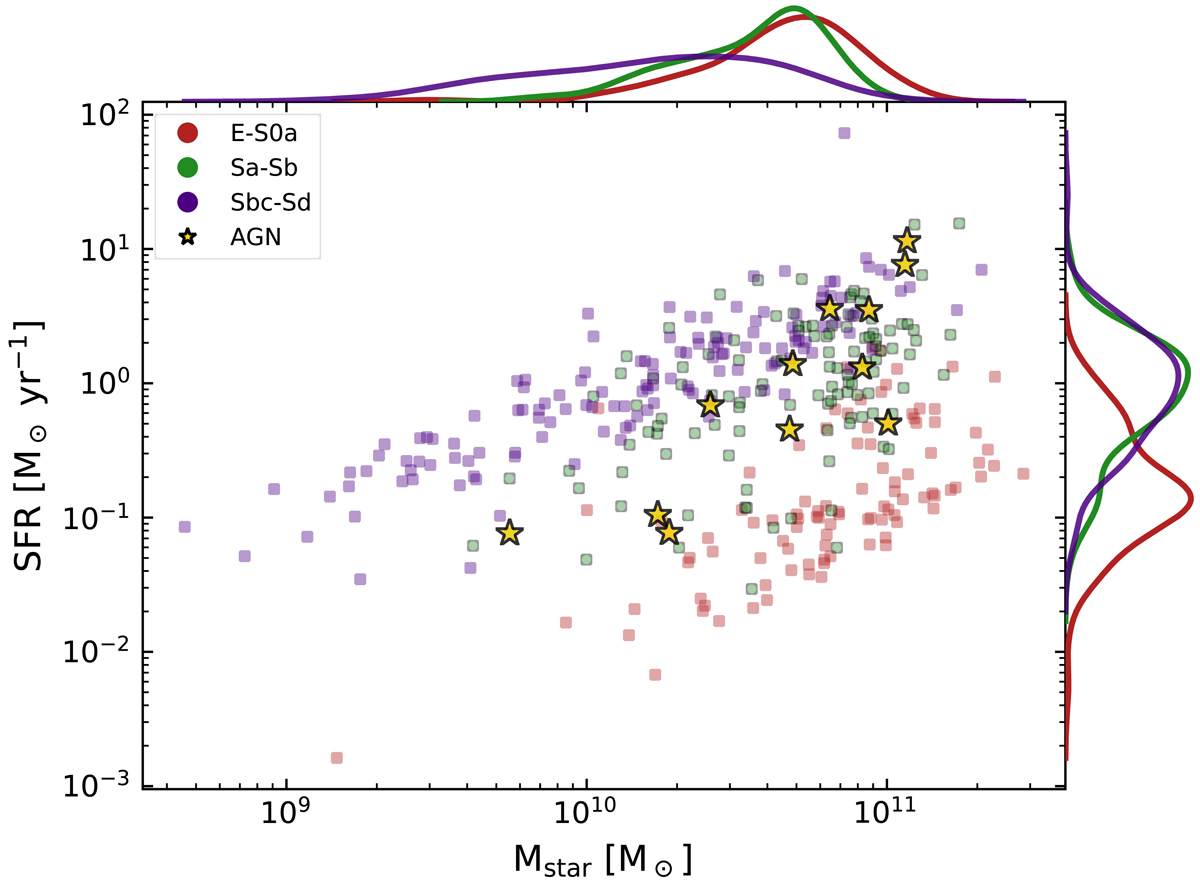
Scatter plot of the relation between SFR versus stellar mass. Galaxies are colour-coded according to their morphological type, and divided into three broad morphological groups as indicated in the legend of the figure. AGN galaxies are marked with golden stars. The normalised distributions of each galaxy population are shown on the top and right sides of the figure.
Current usage metrics show cumulative count of Article Views (full-text article views including HTML views, PDF and ePub downloads, according to the available data) and Abstracts Views on Vision4Press platform.
Data correspond to usage on the plateform after 2015. The current usage metrics is available 48-96 hours after online publication and is updated daily on week days.
Initial download of the metrics may take a while.