Fig. 8
Download original image
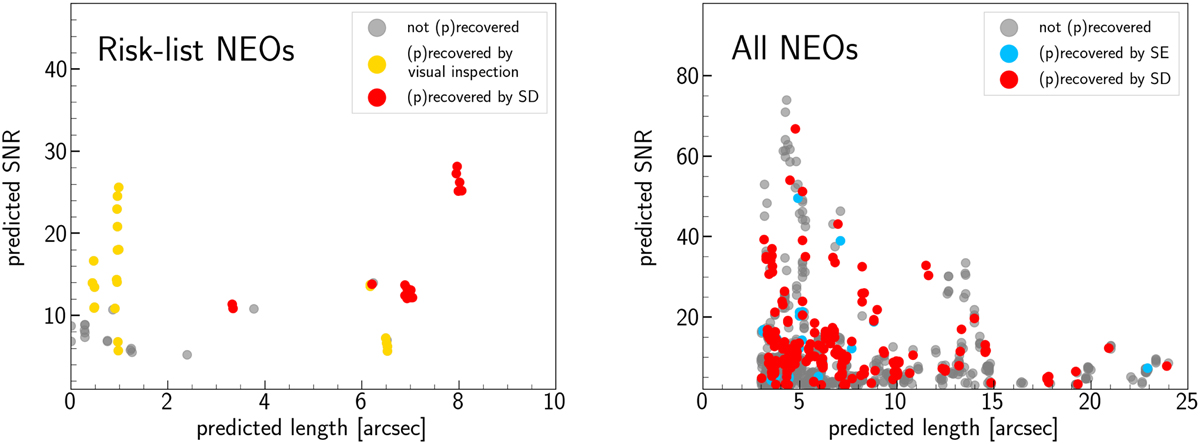
Predicted S/N and predicted length for precovered NEOs. Left: NEOs of the risk list, precovered automatically using the pipeline (red points) or manually by visual inspection of frames (yellow points), and non-precovered risk list NEOs in the OmegaCAM data (grey points). Right: NEOs of the full list, precovered automatically using the pipeline and STREAKDET (red points) and SEXTRACTOR (blue points), and non-precovered full list NEOs in the OmegaCAM data (grey points).
Current usage metrics show cumulative count of Article Views (full-text article views including HTML views, PDF and ePub downloads, according to the available data) and Abstracts Views on Vision4Press platform.
Data correspond to usage on the plateform after 2015. The current usage metrics is available 48-96 hours after online publication and is updated daily on week days.
Initial download of the metrics may take a while.