Fig. 3
Download original image
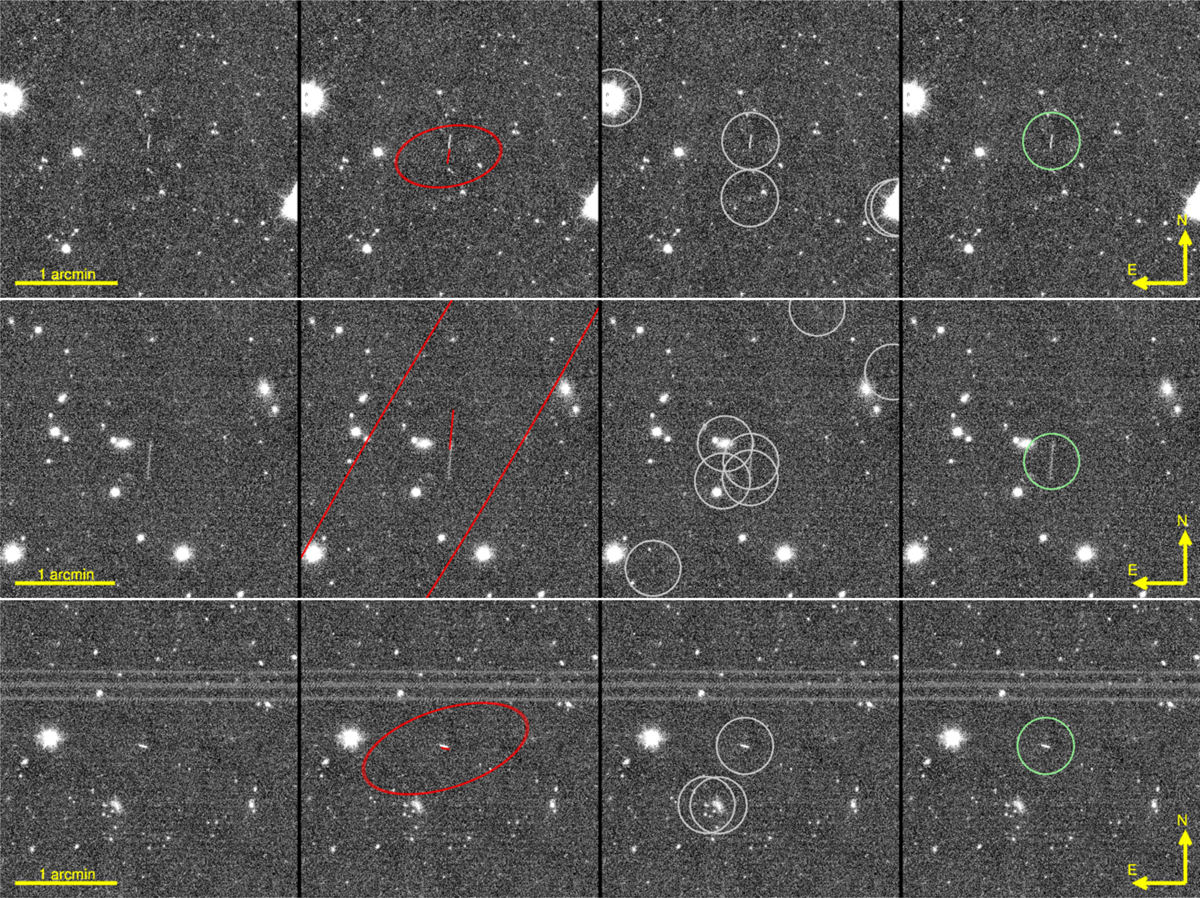
Results of the streak detection using STREAKDET for three examples. From left to right: the first column shows the calibrated cutout around the predicted position of NEOs. The second column shows the 3σ uncertainty ellipse (in red) and the predicted appearance of the NEO considering its speed and direction of motion (red line). The third column shows the detected streaks across frames by STREAKDET (grey circles). The fourth column shows the streaks that match the predicted properties of the NEOs (green circles).
Current usage metrics show cumulative count of Article Views (full-text article views including HTML views, PDF and ePub downloads, according to the available data) and Abstracts Views on Vision4Press platform.
Data correspond to usage on the plateform after 2015. The current usage metrics is available 48-96 hours after online publication and is updated daily on week days.
Initial download of the metrics may take a while.