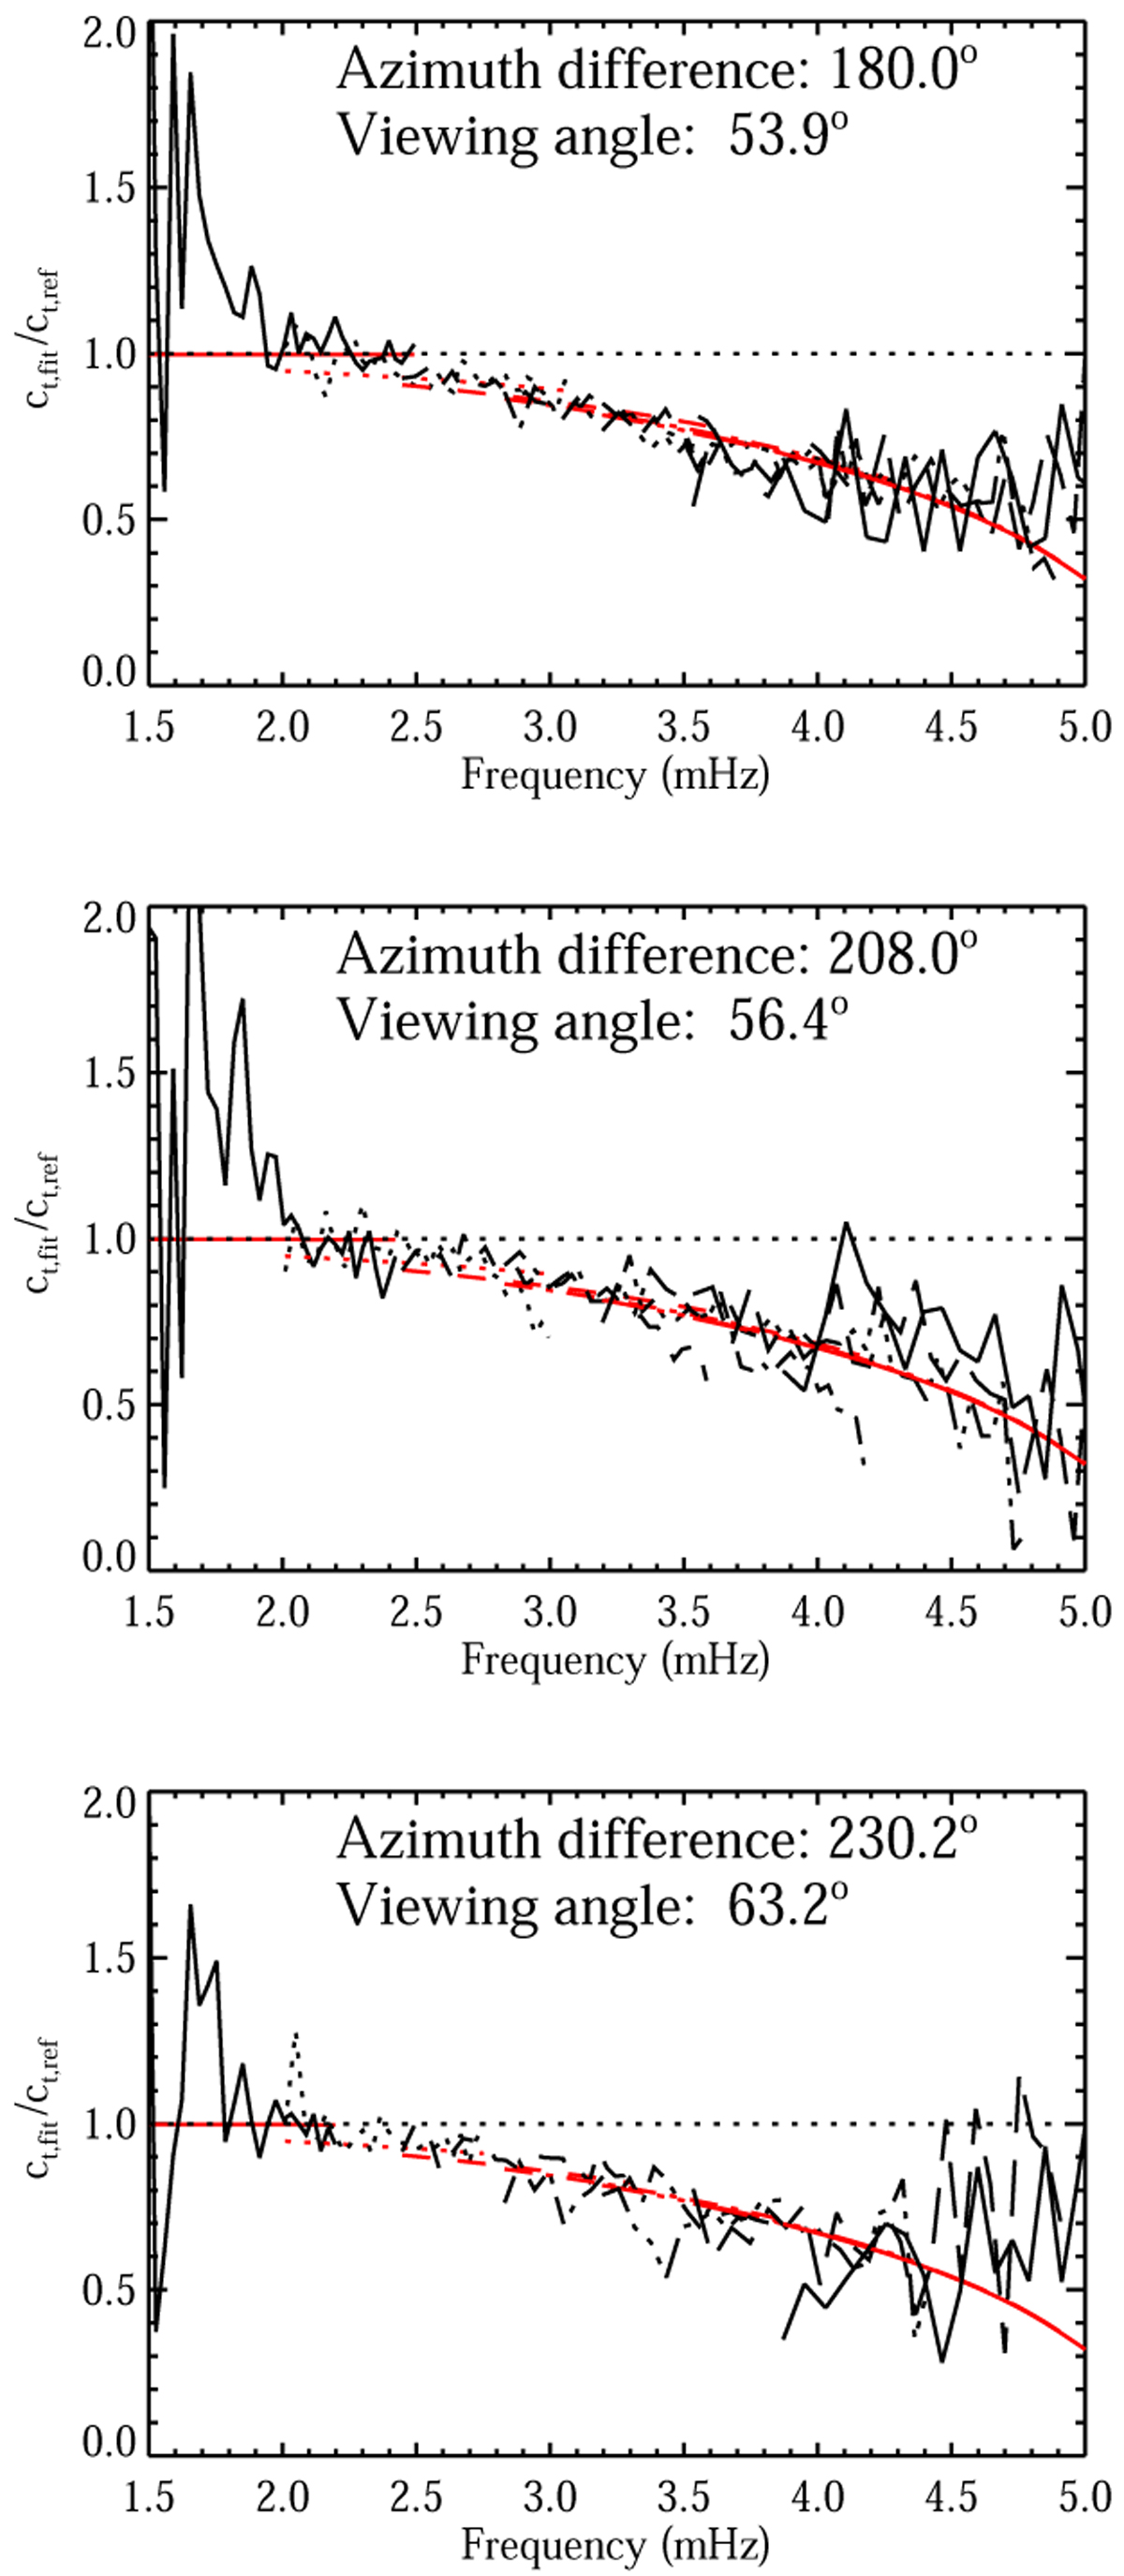
Fig. 5.

Download original image
Ratios ct,fit/ct,ref for selected locations. The top panel corresponds to the green diamond in Fig. 2, the middle panel to the black diamond 20° above, and the bottom panel to 40° above. To constrain the unknown shift, the choice where the mean ratio is 1.0 for 2.5 mHz ≤ν≤ 3.5 mHz was used. In each panel the azimuth difference between SO/PHI and HMI is given, together with the viewing angle, which is common between the instruments. As in Fig. 4, the smooth red curves show ct,ad for a height of 190 km, corresponding to the top case. The ct,ad values for the heights corresponding to the two other cases are indistinguishable at the scale of the plots.
Current usage metrics show cumulative count of Article Views (full-text article views including HTML views, PDF and ePub downloads, according to the available data) and Abstracts Views on Vision4Press platform.
Data correspond to usage on the plateform after 2015. The current usage metrics is available 48-96 hours after online publication and is updated daily on week days.
Initial download of the metrics may take a while.


