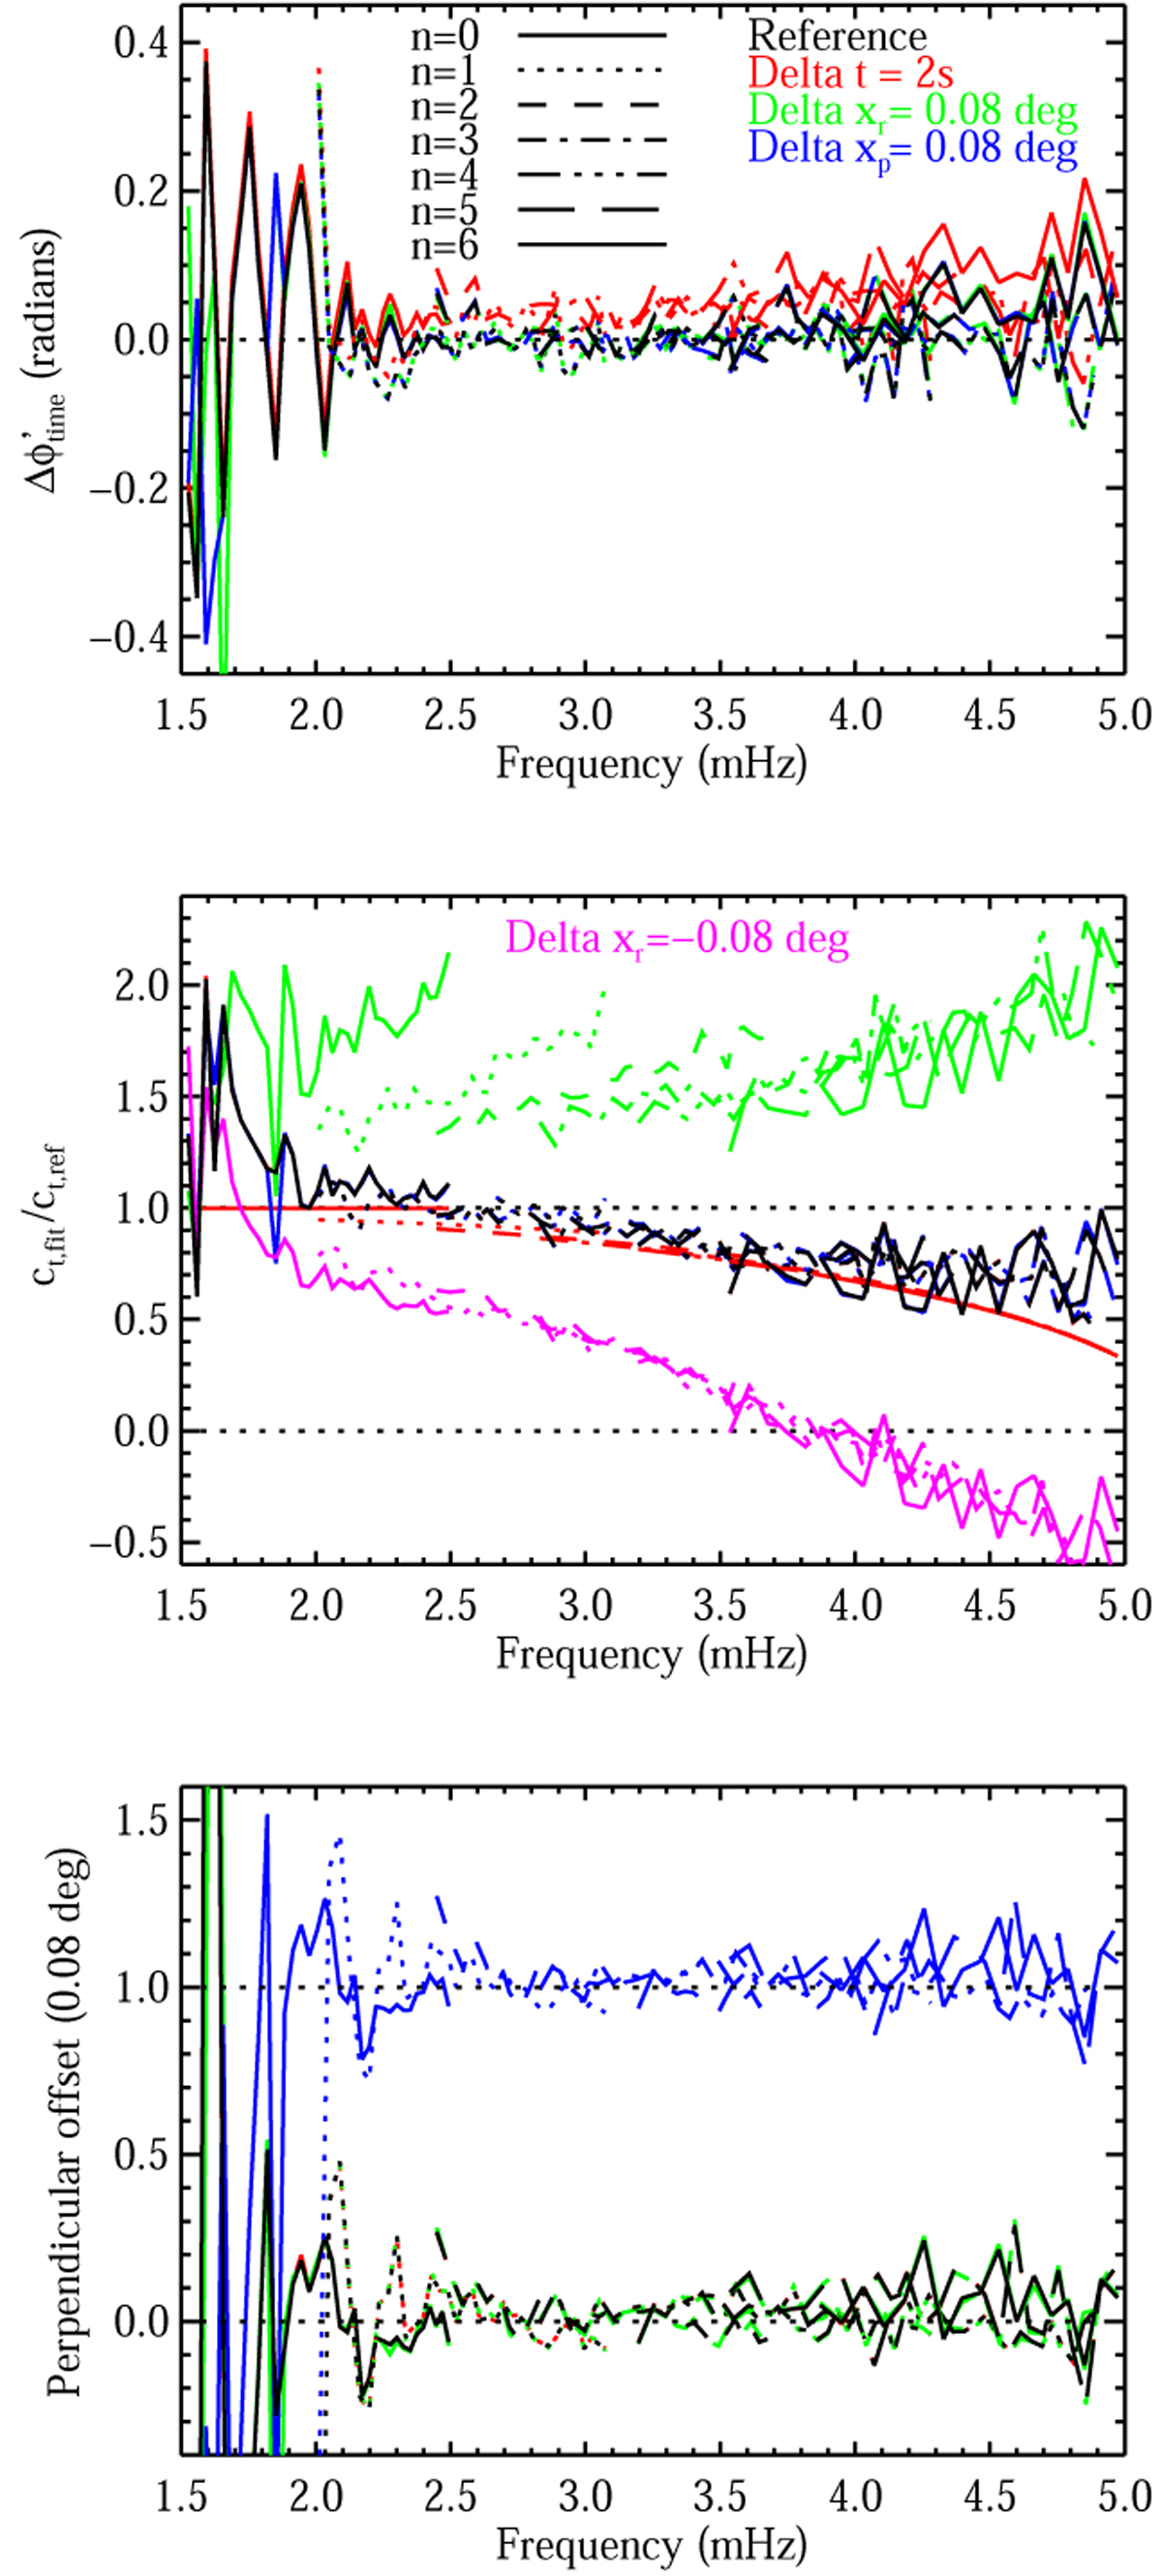
Fig. 4.
Download original image
Fitted parameters for the target halfway between the sub-spacecraft points (green diamond in Fig. 2) assuming ϕh = 0. Results for each radial order n are connected by lines (see legend in top panel). In the middle panel the fitted ct values are divided by ct,ref for ease of display. Black lines indicate the results with the nominal time shift and image offsets. Red lines show the fits resulting from an arbitrary additional shift of 2 s between the instruments. Green and blue lines show the results obtained by shifting the SO/PHI data relative to the HMI data by an additional 1.0 remapped pixel in the fitted cubes (0.08°). The green lines use a shift in the direction of the maximum phase difference, the blue in the orthogonal direction. In the middle panel the magenta lines show the results for a shift in the opposite direction (i.e., by −1.0 pixels vs. +1.0 pixels for the green lines). The black lines are plotted last, and hence the other colors are often invisible. To avoid poor fits, only modes with l ≥ 200, k≤ 0.9 times the Nyquist frequency for SO/PHI (l ≈ 620) and 1.5 mHz ≤ν ≤ 5.0 mHz are shown. The smooth red curves show ct,ad.
Current usage metrics show cumulative count of Article Views (full-text article views including HTML views, PDF and ePub downloads, according to the available data) and Abstracts Views on Vision4Press platform.
Data correspond to usage on the plateform after 2015. The current usage metrics is available 48-96 hours after online publication and is updated daily on week days.
Initial download of the metrics may take a while.