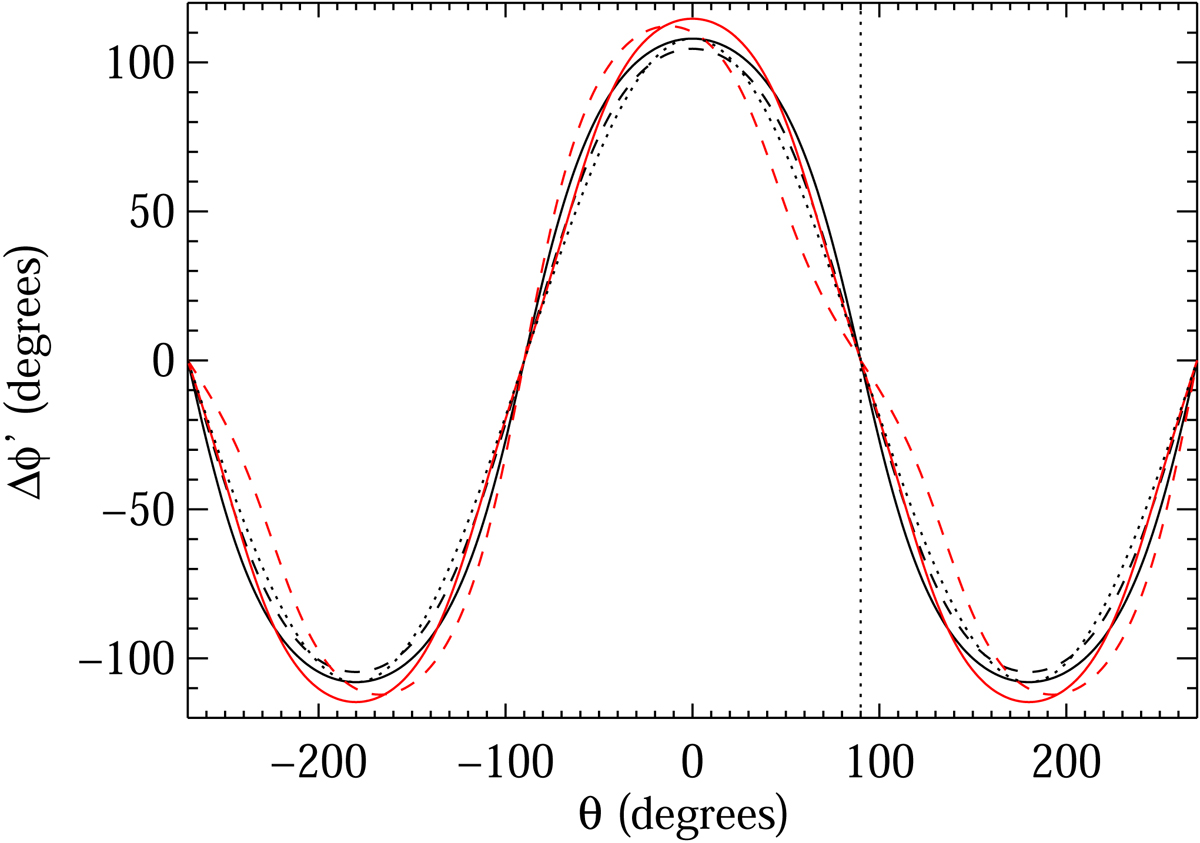
Fig. 3.
Download original image
Examples of predicted phase differences between HMI and SO/PHI for an f-mode (ct = 1.0) and α = 54°. The zero point of θ is chosen as the direction between the instruments. Black curves show results for ϕh = 0, red for ϕh = 45°. Solid curves are for SO/PHI and HMI observing from opposite azimuths, corresponding to the green diamond in Fig. 2. Dashed curves are for a case with 140° difference between the viewing azimuths, corresponding roughly to the points 30° (six points) away from the green diamond in Fig. 2. The dotted black curve is a cosine, for reference. The vertical dotted line shows the midpoint between the viewing directions, where the phase difference is zero. The azimuth is shown over more than 360° for clarity.
Current usage metrics show cumulative count of Article Views (full-text article views including HTML views, PDF and ePub downloads, according to the available data) and Abstracts Views on Vision4Press platform.
Data correspond to usage on the plateform after 2015. The current usage metrics is available 48-96 hours after online publication and is updated daily on week days.
Initial download of the metrics may take a while.