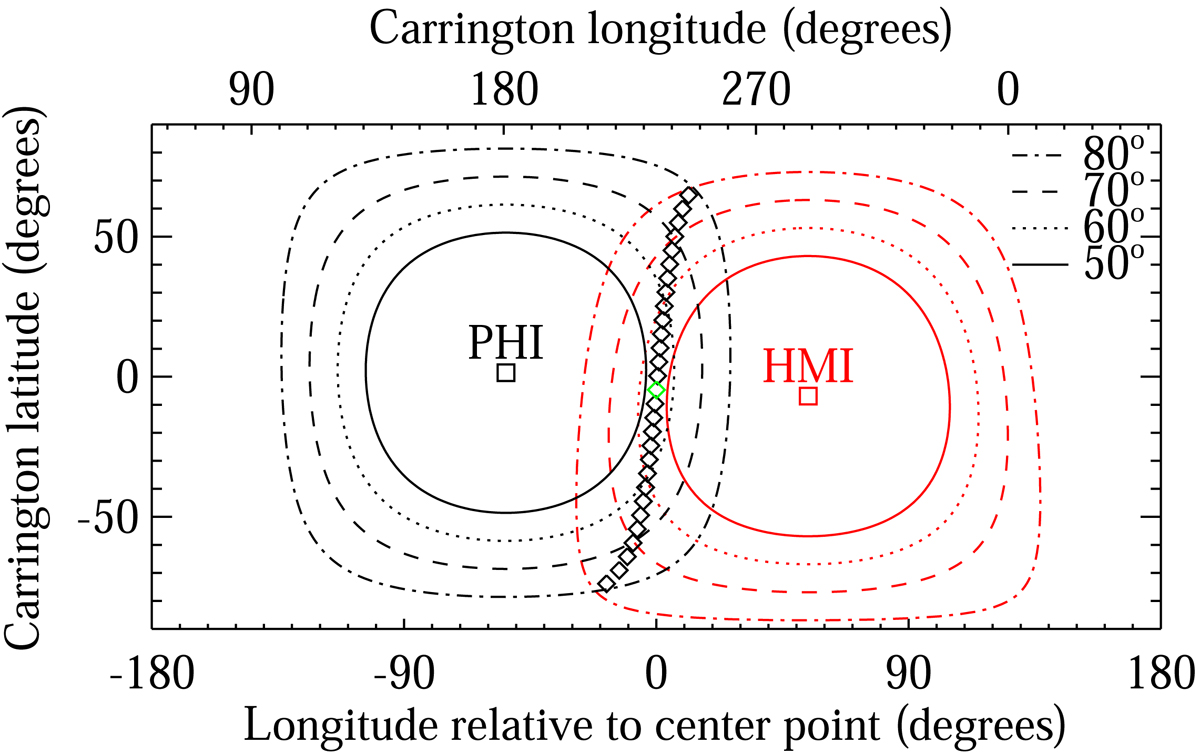
Fig. 2.
Download original image
Observing geometry. The location of the SO/PHI and HMI sub-spacecraft points at the midpoint of the observations are shown by squares. The closed curves indicate the viewing angles for the two instruments (see legend, top right corner) relative to the local surface normal. Diamonds indicate the locations used for the analysis. The green diamond indicates the midpoint between the two instruments. The black diamonds are spaced by 5°.
Current usage metrics show cumulative count of Article Views (full-text article views including HTML views, PDF and ePub downloads, according to the available data) and Abstracts Views on Vision4Press platform.
Data correspond to usage on the plateform after 2015. The current usage metrics is available 48-96 hours after online publication and is updated daily on week days.
Initial download of the metrics may take a while.