Fig. 1.
Download original image
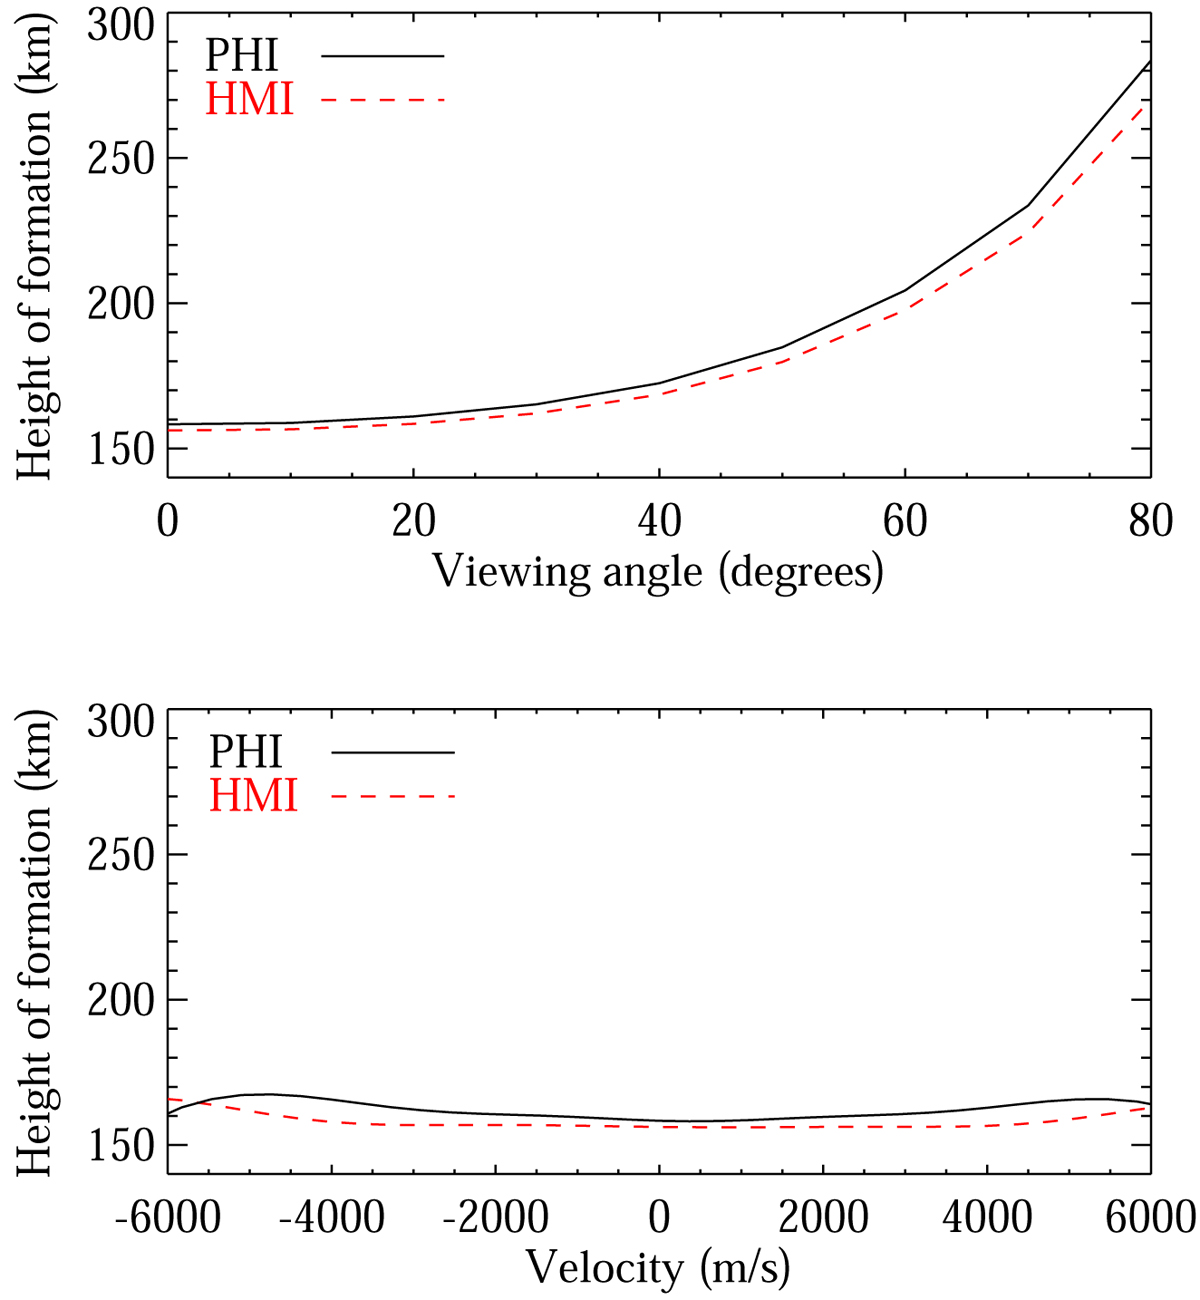
Effective observing height for the two instruments. Top: height as a function of viewing angle at V = 0 m/s. Bottom: height as a function of an added velocity at 0° viewing angle. The heights are calculated as described in the main text and are relative to the continuum τ = 1. For consistency, both plots have the same height range.
Current usage metrics show cumulative count of Article Views (full-text article views including HTML views, PDF and ePub downloads, according to the available data) and Abstracts Views on Vision4Press platform.
Data correspond to usage on the plateform after 2015. The current usage metrics is available 48-96 hours after online publication and is updated daily on week days.
Initial download of the metrics may take a while.