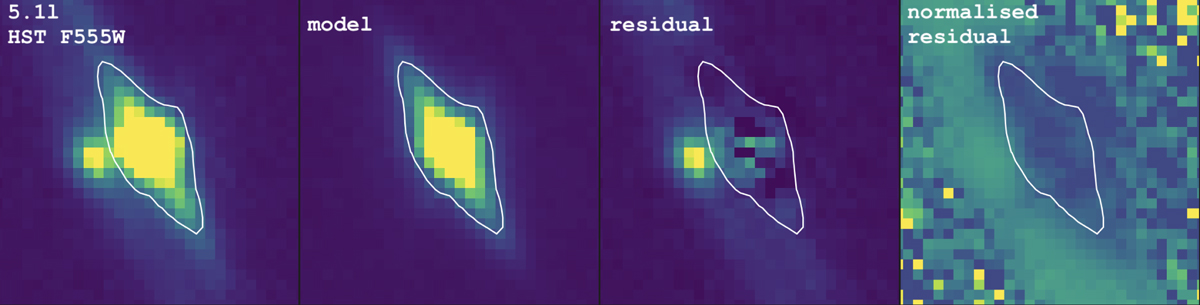
Fig. 5.
Download original image
Results from Galfit modeling after using a two-component fit. From the left, the first panel shows source 5.1l in the F555W band (UV 1700 Å). The second panel shows the model from Galfit. The third panel shows the residual, and the fourth panel is the normalized residual produced after dividing the residual with the original image. The white contour encloses the region we used to check the quality of the produced model.
Current usage metrics show cumulative count of Article Views (full-text article views including HTML views, PDF and ePub downloads, according to the available data) and Abstracts Views on Vision4Press platform.
Data correspond to usage on the plateform after 2015. The current usage metrics is available 48-96 hours after online publication and is updated daily on week days.
Initial download of the metrics may take a while.