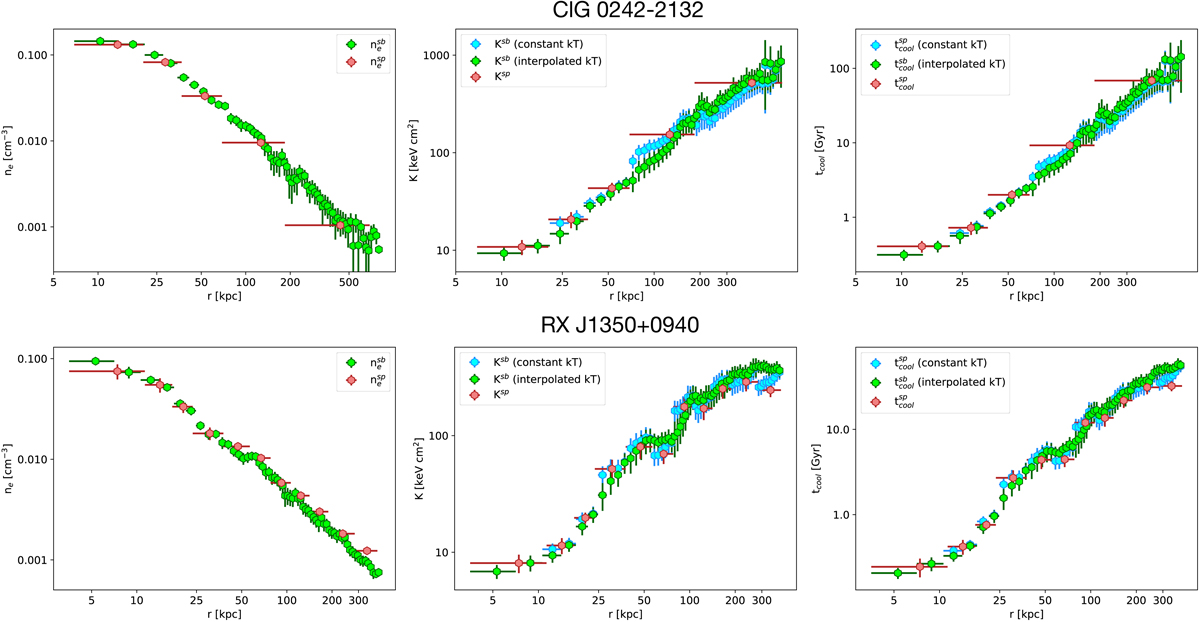
Fig. B.1.
Download original image
Comparison between the profiles of density, entropy, and cooling time obtained with different methods. Green corresponds to the profiles obtained with the method described in Sect. 3.2 and Appendix B; cyan is the result of combining the density profile from the surface brightness profile with the temperature profile (without interpolating the temperature profile); red is the result of combining the density and the temperature derived from spectral fitting.
Current usage metrics show cumulative count of Article Views (full-text article views including HTML views, PDF and ePub downloads, according to the available data) and Abstracts Views on Vision4Press platform.
Data correspond to usage on the plateform after 2015. The current usage metrics is available 48-96 hours after online publication and is updated daily on week days.
Initial download of the metrics may take a while.